One material property that is widely used and recognized is the strength of a material. But what does the word "strength" mean? "Strength" can have many meanings, so let us take a closer look at what is meant by the strength of a material. We will look at a very easy experiment that provides lots of information about the strength or the mechanical behavior of a material, called the tensile test.
Engineers and technicians run tensile tests because they need to know exactly how a material behaves when you pull on it. In short, tensile testing is the fundamental way to quantify how "strong," "stiff," and "ductile" a material really is—and that information is critical for safe, reliable design, for assuring consistent manufacturing quality, and for meeting regulatory or customer requirements.
What is a Tensile Strength Test?
Tensile refers to a material's capability of handling tension. The basic idea of a tensile strength test is to place a sample of a material between two fixtures called "grips" which clamp the material. The material has known dimensions, like length and cross-sectional area. We then begin to apply weight to the material gripped at one end while the other end is fixed. We keep increasing the weight (often called the load or force) while at the same time measuring the change in length of the sample.
Tensile Test Procedure
In industry, tensile testing typically follows these steps:
- Specimen Preparation
- Environmental Conditioning
-
Machine Calibration and Setup
- Select Test Parameters
- Run the Test
- Data Collection and Calculations
- Post-Test Inspection and Reporting
By using the following demonstration as a guide, one can do a very simplified tensile test at home.
The screen displays a "Tensile Test" diagram on a neutral gradient. A green material specimen is held vertically between two black grips—the upper fixed and the lower attached to a rod.
As the test progresses, a cylindrical metallic actuator rises along the lower rod, applying upward force to pull the specimen. This increasing load is visualized by three orange dashed lines appearing sequentially at the bottom right. The animation concludes with the stabilized apparatus showing the sample under tension, illustrating the mechanical pulling process.
- Hang one end of some material from a solid point that does not move.
- Hang weights on the other end.
- Measure the change in length while adding weight until the part begins to stretch and finally breaks.
- The result of this test is a graph of load (amount of weight) versus displacement (amount it stretched).
Since the amount of weight needed to stretch the material depends on the size of the material (and of course the properties of the material), comparison between materials can be very challenging.
The ability to make a proper comparison can be very important to someone designing for structural applications where the material must withstand certain forces.
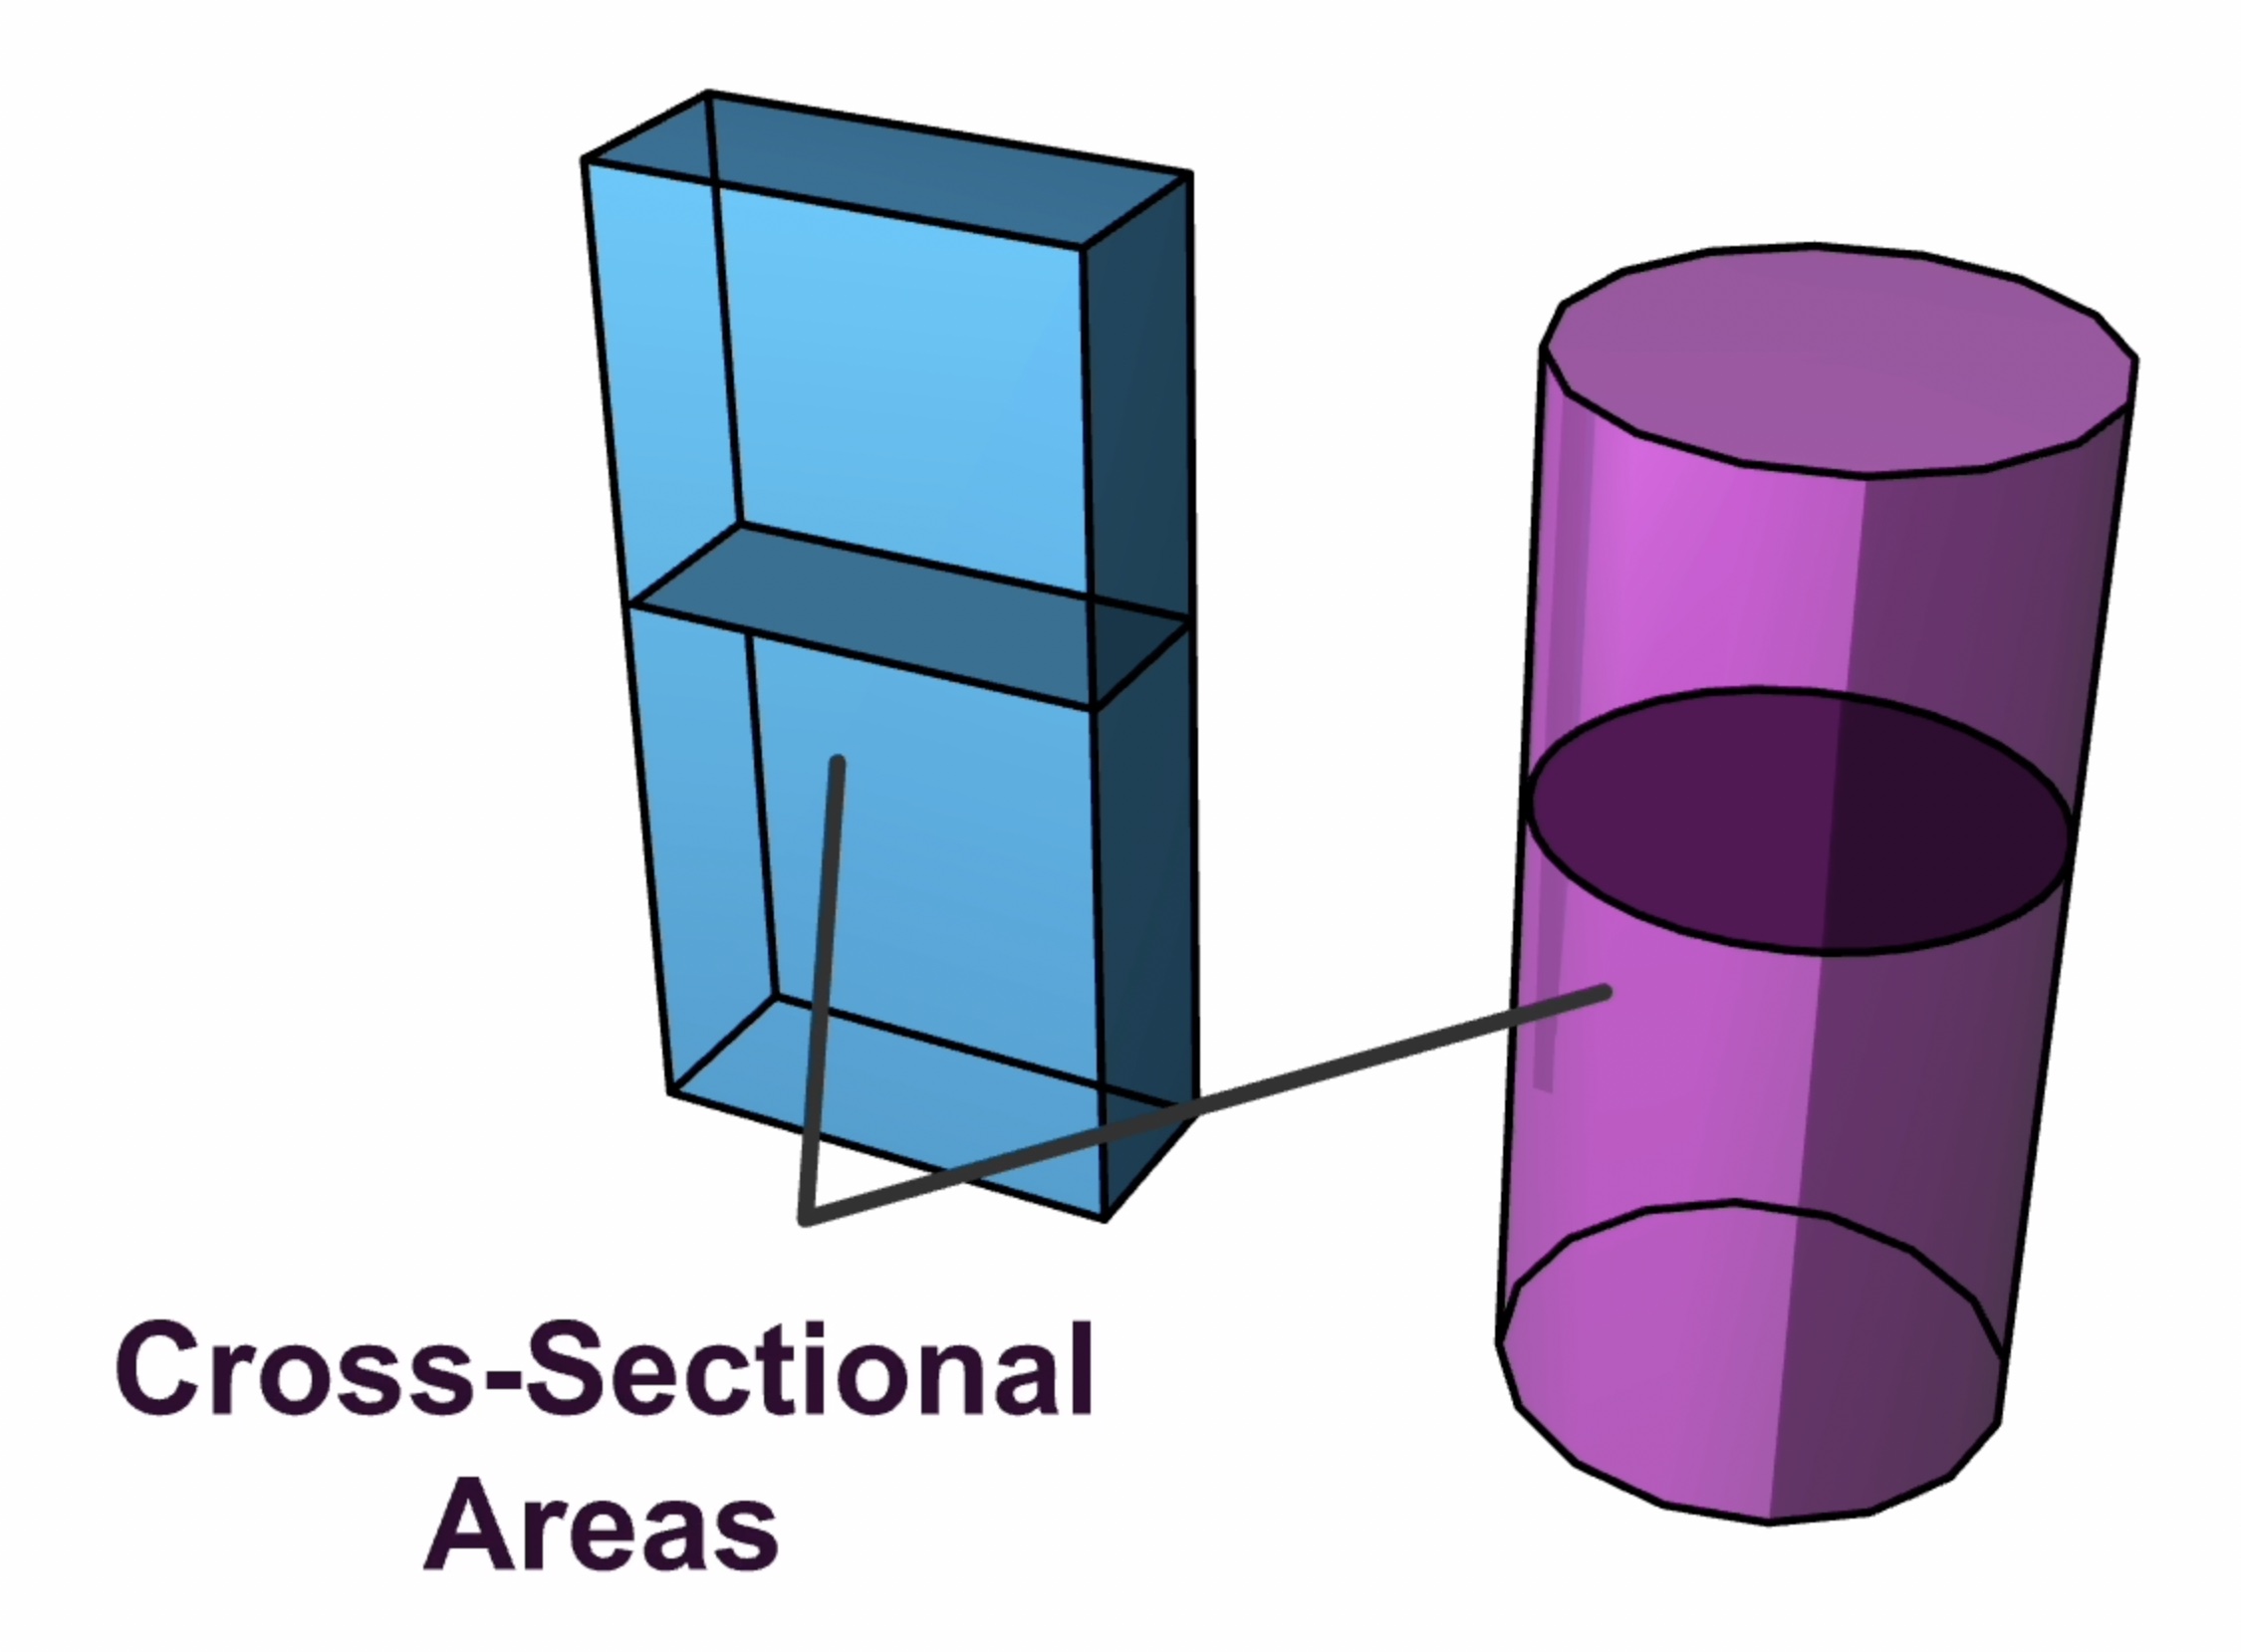
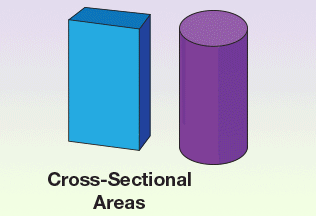
Tensile Test: Cross-Sectional Areas
The animation, set on a dark gradient with the title "Cross Sections," depicts the sequential removal of material from a rectangular block to reveal its internal structure.
Initially, the top surface is highlighted; then, thin horizontal layers are progressively sliced away. Each removal exposes a deeper internal plane, illustrating how sequential sectioning allows for the inspection and imaging of a material's interior features. The process concludes with a partially sectioned block, reinforcing the concept of deep-layer analysis.
We need a way of directly being able to compare different materials, making the "strength" we report independent of the size of the material. We can do that by simply dividing the load applied to the material (the weight or force) by the initial cross-sectional area. We also divide the amount it moves (displacement) by the initial length of the material. This creates what material scientists refer to as engineering stress (load divided by the initial cross-sectional area) and engineering strain (displacement divided by initial length). By looking at the engineering stress-strain response of a material we can compare the strength of different materials, independently of their sizes.
To use the stress-strain response for designing structures, we can divide the load we want by the engineering stress to determine the cross-sectional area needed to be able to hold that load. For example, a 1/8" diameter 4340 steel wire can hold a small car. Again, it is not always that simple. We need to understand the different meanings of "strength" or engineering stress.
Tensile Test: Stress Versus Strain
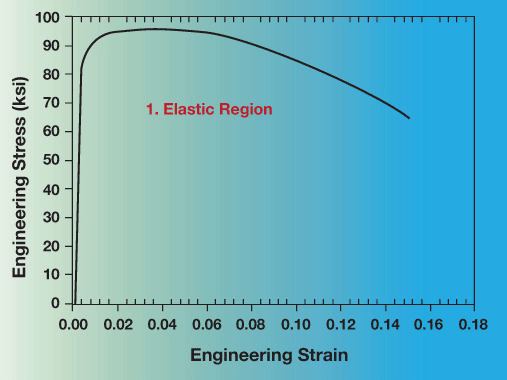
Set against a dark gradient with the title “Stress–Strain Curve,” the animation plots the relationship between stress (vertical axis) and strain (horizontal axis).
The curve originates at zero and climbs a straight diagonal line, representing the elastic region. It then bends at the yield point, marking the transition to permanent plastic deformation. The line continues to a peak—the Ultimate Tensile Strength—before sloping downward during necking and terminating at the fracture point. The final static image provides a complete visual history of the material’s journey from initial loading to total failure.
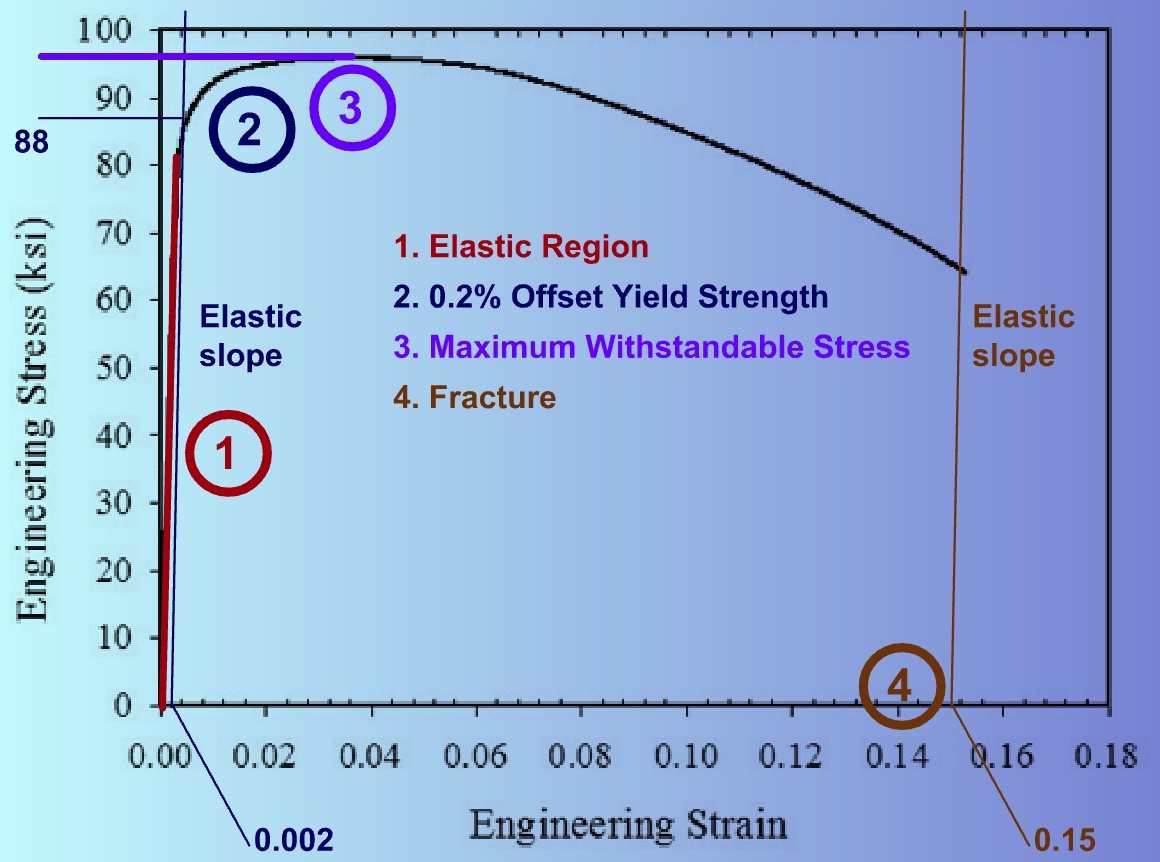
Now it gets more complicated. Let us take a look at what is meant by the different strength values and also look at other important properties we can get from this simple test. The easiest way is to examine a graph of engineering stress versus engineering strain. Shown below is a graph of a tensile test for a common steel threaded rod, providing a good example of a general metal tensile test. The units of engineering stress are ksi, which stands for a thousand pounds per square inch. Note the reference to area in the units. The units on strain are of course unitless, since we are dividing distance by distance.
 As we move up from point 2 the load or "stress" on the material increases until we
reach a maximum applied stress, while the material deforms or changes shape uniformly
along the entire gauge length. When we reach point 3, we can determine the tensile
strength or maximum stress (or load) the material can support. It is not a very useful
property, since the material has permanently deformed at this point. After we reach
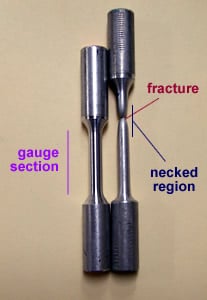
this point, the stress begins to curve drastically downward. This corresponds to localized
deformation, which is observed by a noticeable "necking" or reduction in the diameter
and corresponding cross-section of the sample within a very small region. If we release
the load in this area, the material will spring back a little but will still suffer
a permanent shape change.
As we move up from point 2 the load or "stress" on the material increases until we
reach a maximum applied stress, while the material deforms or changes shape uniformly
along the entire gauge length. When we reach point 3, we can determine the tensile
strength or maximum stress (or load) the material can support. It is not a very useful
property, since the material has permanently deformed at this point. After we reach
this point, the stress begins to curve drastically downward. This corresponds to localized
deformation, which is observed by a noticeable "necking" or reduction in the diameter
and corresponding cross-section of the sample within a very small region. If we release
the load in this area, the material will spring back a little but will still suffer
a permanent shape change.
Finally, as we follow the curve we eventually reach a point where the material breaks
or fails. Of interest here is the final degree to which the material changes shape.
This is the "ductility" of the material. It is determined by the intersection of line
number 4, having the same slope as the linear portion of the curve, with the strain
axis.
Our example shows a strain of 0.15. The 15% change in length is the amount of "ductility".
When the sample fractures or breaks the load is released. Therefore, the atoms elastically stretched will return to their non-loaded positions. Other information about the mechanical response of a material can also be gathered from a fracture test.
Tensile Tests Procedures for Composites
If one pulls on a material until it breaks, one can find out lots of information about the various strengths and mechanical behaviors of a material. In this tensile test virtual experiment we will examine the tensile behavior of three different composite fiber materials. They have similar uses but very different properties.
 A material is gripped at both ends by an apparatus, which slowly pulls lengthwise
on the piece until it fractures. The pulling force is called a load, which is plotted
against the material length change, or displacement. The load is converted to a stress
value and the displacement is converted to a strain value.
A material is gripped at both ends by an apparatus, which slowly pulls lengthwise
on the piece until it fractures. The pulling force is called a load, which is plotted
against the material length change, or displacement. The load is converted to a stress
value and the displacement is converted to a strain value.
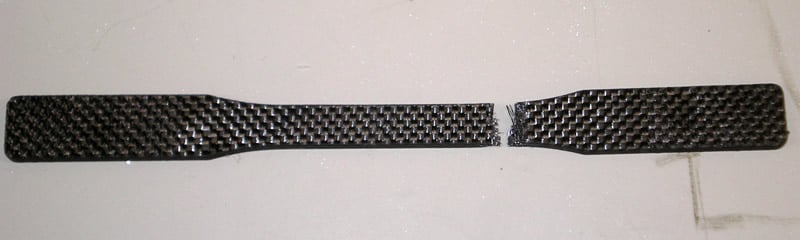
 Testing materials are the composites fiberglass, Kevlar®, and carbon fiber. Composites
are combinations of two or more individual materials with the goal of producing a
material having unique properties not found in any single material.
Testing materials are the composites fiberglass, Kevlar®, and carbon fiber. Composites
are combinations of two or more individual materials with the goal of producing a
material having unique properties not found in any single material.
All of these composites use epoxy as a matrix, which "glues" the fabric like arrangement of the fibers of the respective materials.
Epoxies are thermosetting network polymers, which are very hard and strong, but on the brittle side.
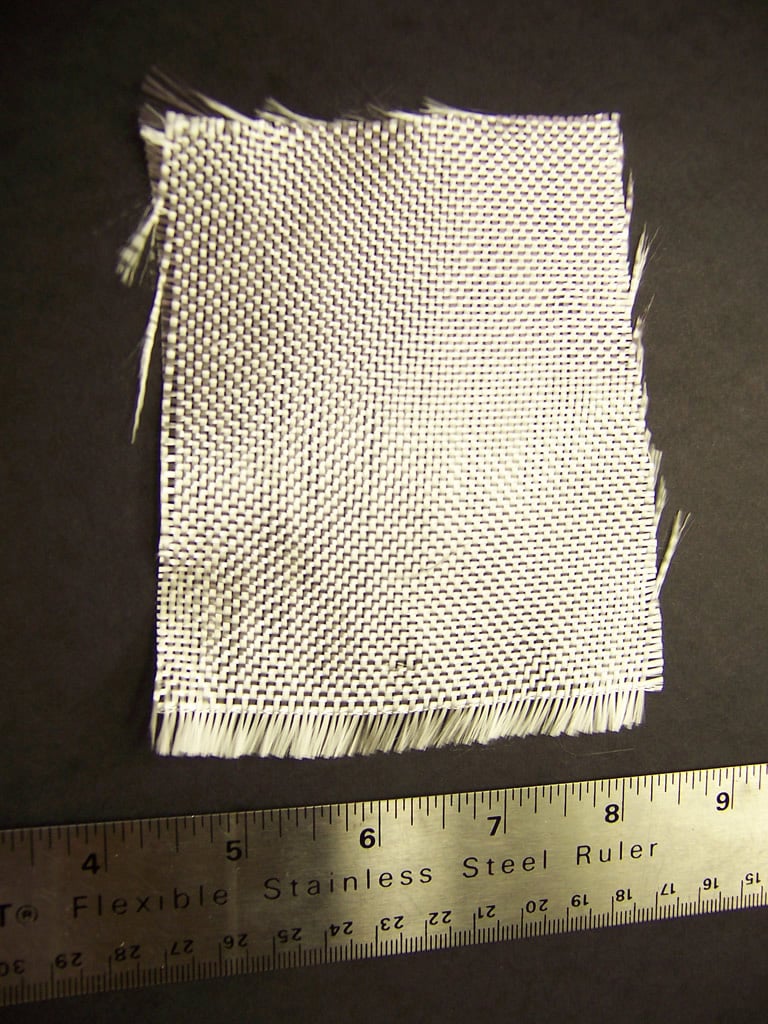
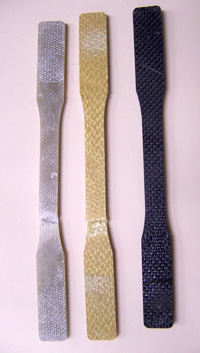 All fabrics are of the same "weight," which is a measure of fabric size or weight
of a square yard. An example of the fiber material made from fiberglass is shown above
left. Kevlar is very similar except it has a yellow color. The carbon has a black
color. The samples used in this case are flat bars cut out of larger material using
a water jet saw. The three samples are shown below left.
All fabrics are of the same "weight," which is a measure of fabric size or weight
of a square yard. An example of the fiber material made from fiberglass is shown above
left. Kevlar is very similar except it has a yellow color. The carbon has a black
color. The samples used in this case are flat bars cut out of larger material using
a water jet saw. The three samples are shown below left.
Composites Experiment

Description: The apparatus pulls on each end of the material until it fractures.
Fiberglass 00:00
Kevlar 01:10
Carbon Fiber 03:09
The video is 5 minutes and 5 seconds with no audio.
Executive Producer Ed Laitila
Host Stephen Forsell
Videographer Britta Lundberg
Composites Final Data
Raw Data for Fiberglass
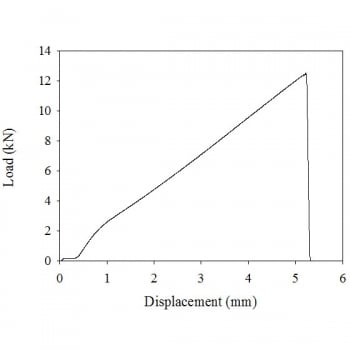
The displacement increases from zero to a little over 5 mm. The load increases almost linearly from 0 to about 12 kN before dropping almost vertically.
Corrected Data For Fiberglass
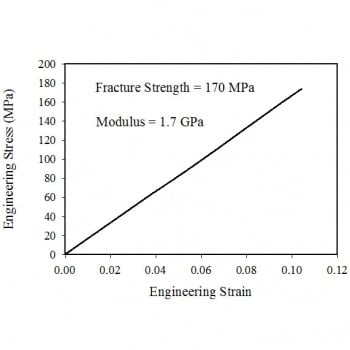
The engineering strain increases from zero to about 0.10. The engineering stress increases linearly from zero to about 170 MPa, the fracture strength. The modulus is 1.7 GPa.
Corrected Data for Kevlar
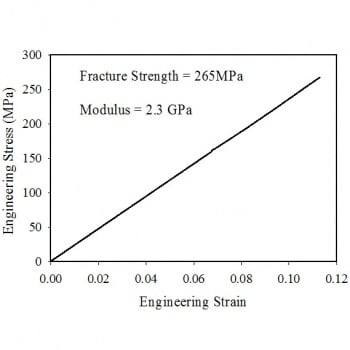
The engineering strain increases from zero to about 0.11. The engineering stress increases linearly from zero to about 265 MPa, the fracture strength. The modulus is 2.3 GPa.
Corrected Data for Carbon Fiber
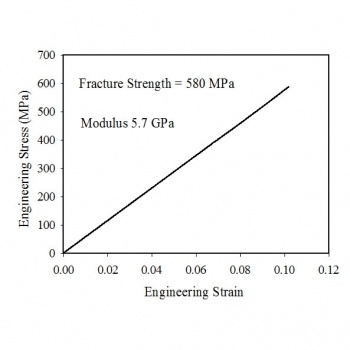
The engineering strain increases from zero to about 0.10. The engineering stress increases linearly from zero to about 580 MPa, the fracture strength. The modulus is 5.7 GPa.
Composites Conclusions
The carbon fiber composite material has a much higher tensile strength and modulus of elasticity than the other materials. Note they all break in a "brittle" manner, as the curve is linear until it breaks or fractures with no bending of the curve at high loads. Consequently, there is no permanent change in original shape during this test, and hence no ductility.
Additional Tensile Test Virtual Experiment Examples
You have seen the experiments for the composite materials. Compare the composite material stress-strain curves with those for polymer and steel.
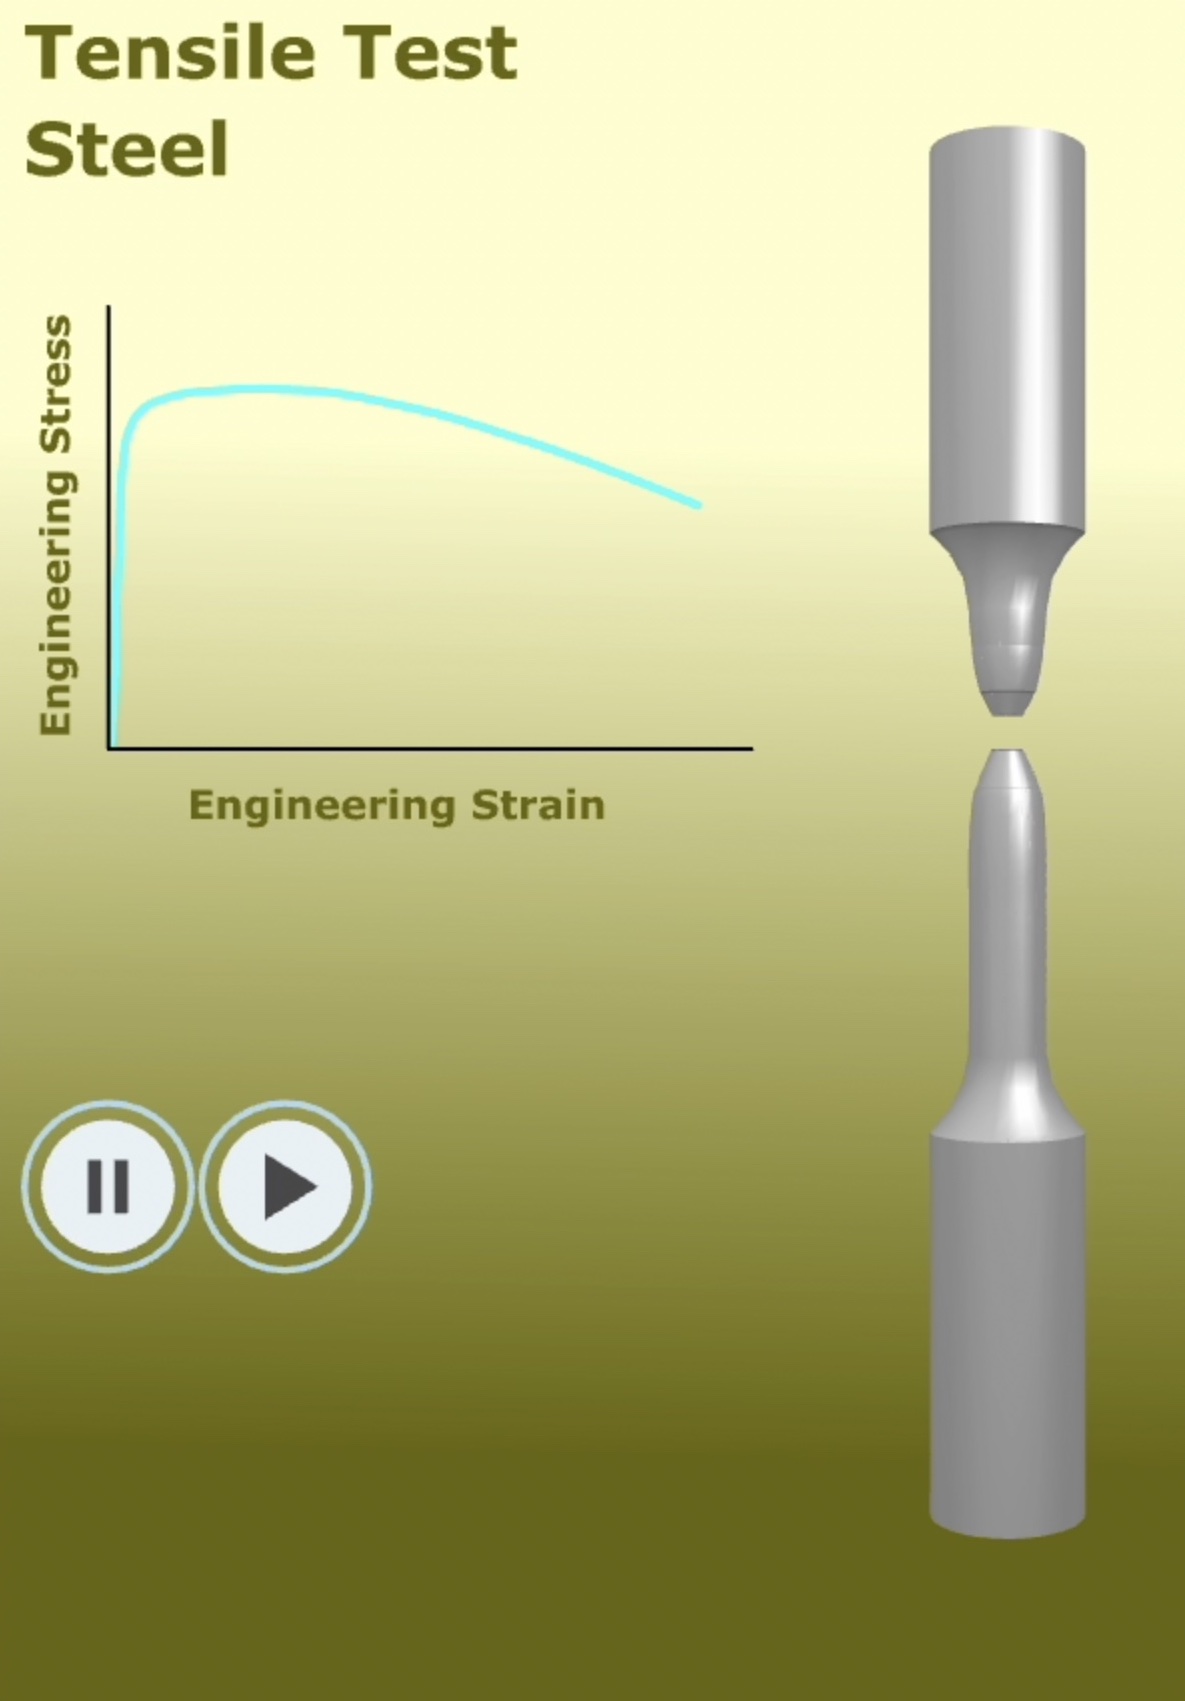
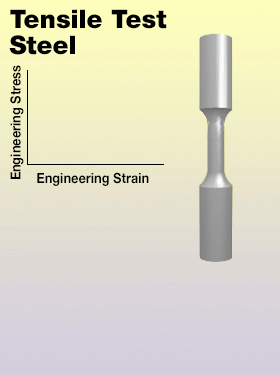
Tensile Test of Steel
The video captures a cylindrical steel specimen mounted vertically between the fixed upper and movable lower crossheads of a tensile testing machine.
As the machine applies tension, the specimen initially elongates while maintaining a uniform diameter. This stretching becomes more pronounced as the material enters plastic deformation. Eventually, a localized narrowing known as necking forms near the center, concentrating the deformation in a thinning region. The metal stretches rapidly at this point until it reaches its breaking point, resulting in a ductile fracture. The animation concludes with the two separated halves of the specimen still held in the grips, displaying rough fracture surfaces.
The necking steel sample has a continuous stress strain relationship. The stress increases almost vertically, then drops gradually.
Tensile Test of a Polymer
This video illustrates the unique deformation of a polymer specimen mounted vertically between a fixed upper grip and a movable lower grip.
As the machine applies tension, the polymer initially elongates uniformly. However, unlike many metals, once necking develops in the center, the material undergoes cold drawing. In this phase, the necked region does not immediately fracture; instead, it propagates along the length of the specimen. This process aligns the polymer chains in the direction of the force, allowing for extreme elongation while maintaining structural integrity. The animation concludes with a significantly lengthened, "drawn" specimen that remains intact.
The stretching polymer sample has a discontinuous stress strain relationship. The stress increases almost vertically, then drops and increases unevenly.

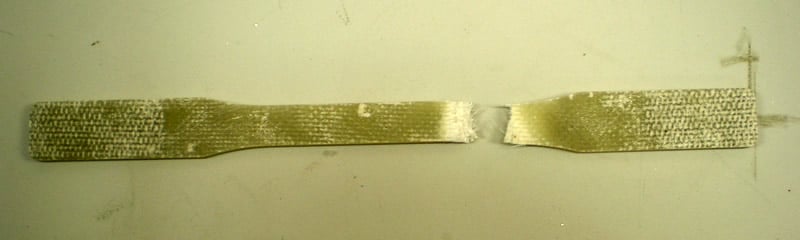
Below are optical photos of the broken or fractured samples, along with close ups of the fracture surface, taken with a scanning electron microscope. Study of these fracture surfaces is also a very important part of materials science and engineering, making this an area of specialty.
Fiberglass


Kevlar®
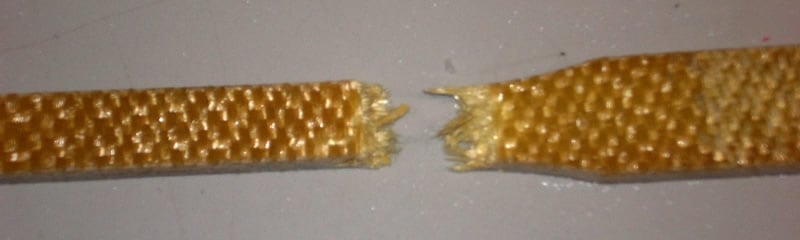


Carbon Fiber