Invasive plants in coastal wetlands of the Great Lakes are degrading wetland habitat, decreasing biodiversity, and reducing ecosystem services. Our objective is to refine and integrate process-based hydrological and ecological models with remote sensing products to investigate how changes in upland land use and climate alter risk of plant invasions and ecosystem services in coastal wetlands.
Linking Ecological and Hydrological Models
Changes in upland land use and climate were simulated in order to understand the impacts of changing water and nutrient loads on coastal ecosystems.
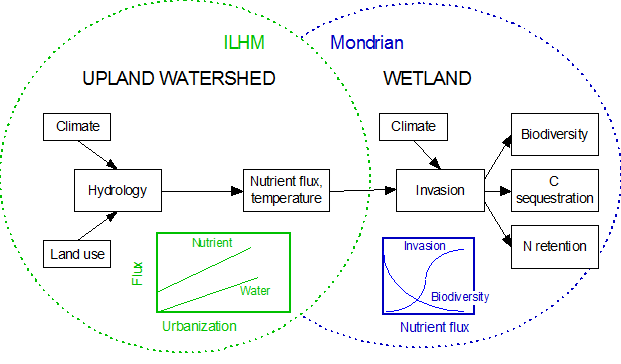
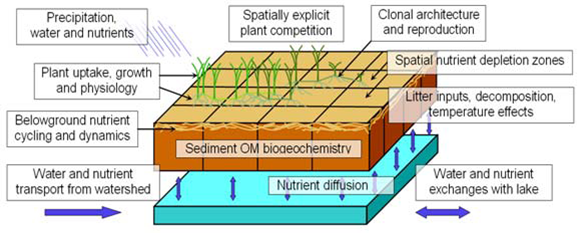
MONDRIAN: Modes of Nonlinear Dynamics in Resource Interactions and Nutrient Cycling
Individual-based ecosystem model spanning five levels of organization:
- Individual ramet growth
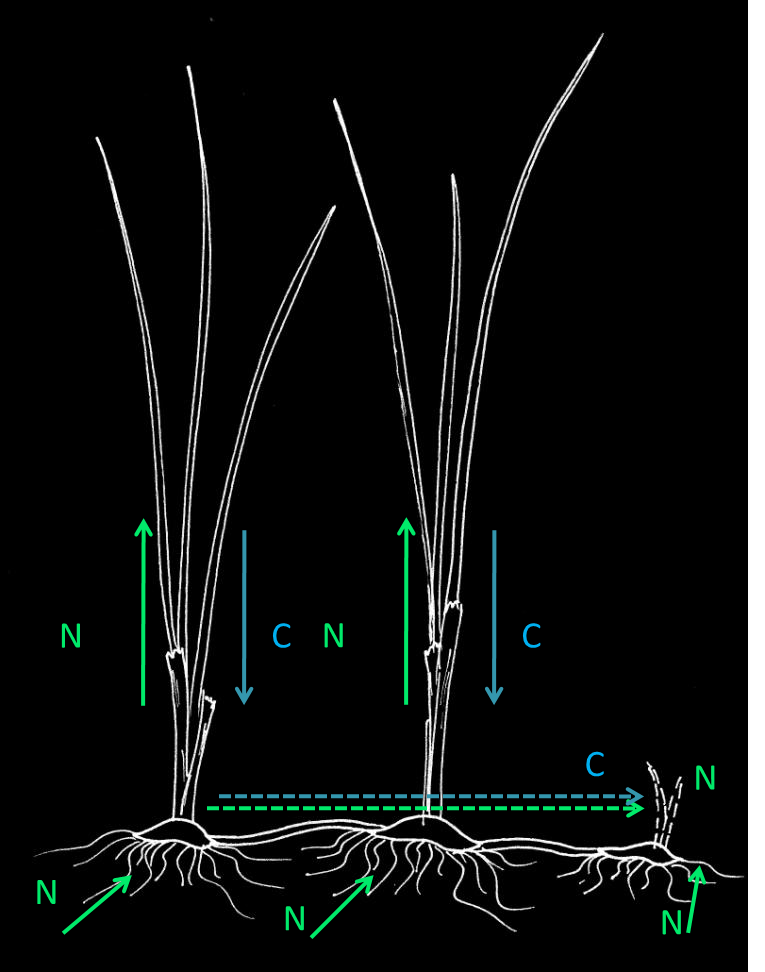
- Translocation of C and N within clones
- Population processes (fecundity, mortality)
- Community modeling (competition for light, N)
- Ecosystem processes (water level, biogeochemistry, closed C and N budgets)
LHM: Landscape Hydrology Model
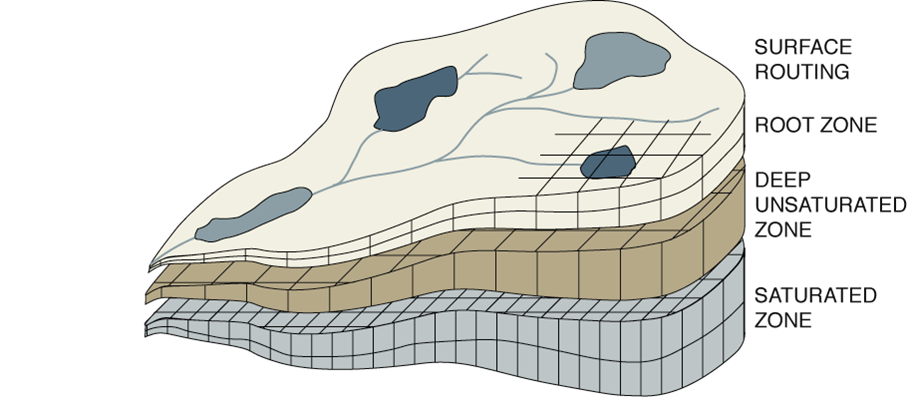
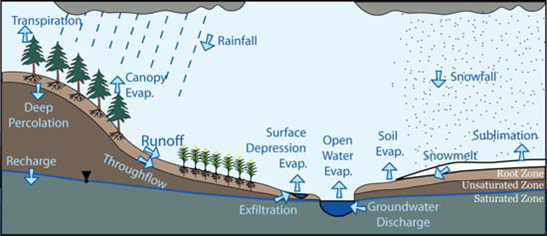
- Simulates full water and energy balance
- Integrated Surface Water and Groundwater
- Interactions between soil water and vegetation
- Fully distributed
- Process based
- Four main zones
Field and Experimental Research
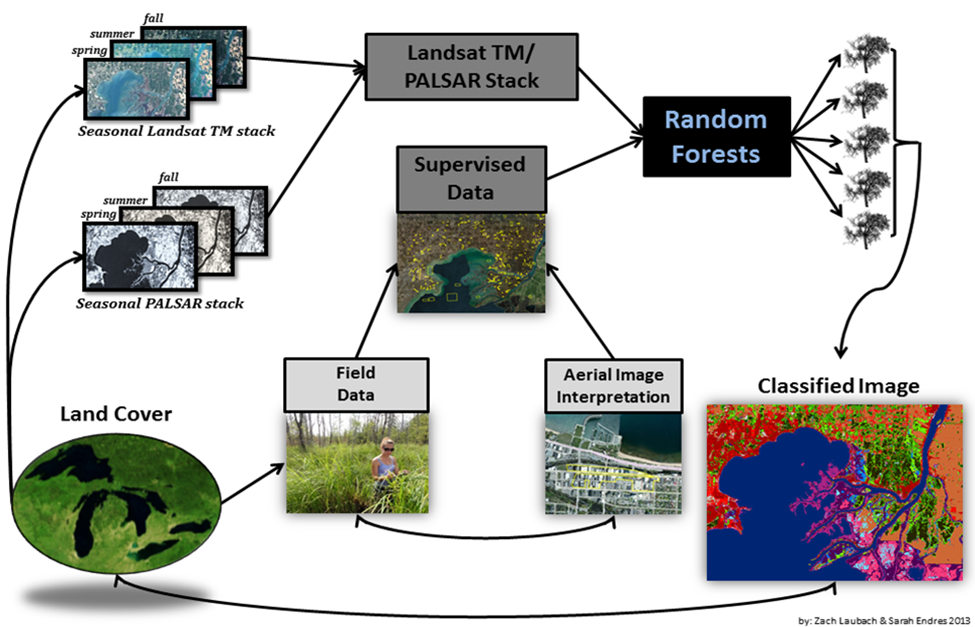
Field work was conducted to understand both the hydrology and plant invasions. Remote sensing data were used for landscape scale validation of results and to parameterize models.
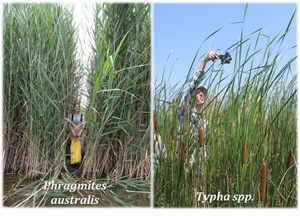
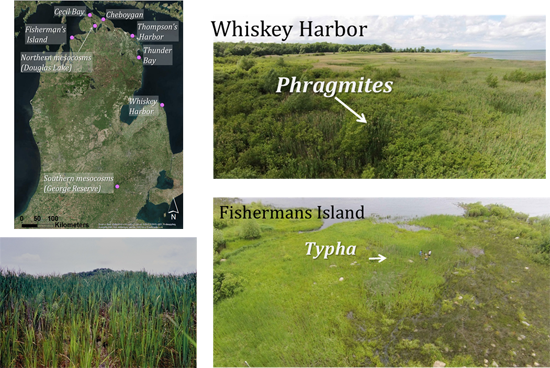
Monitoring Invasion of Problematic Wetland Plant Species
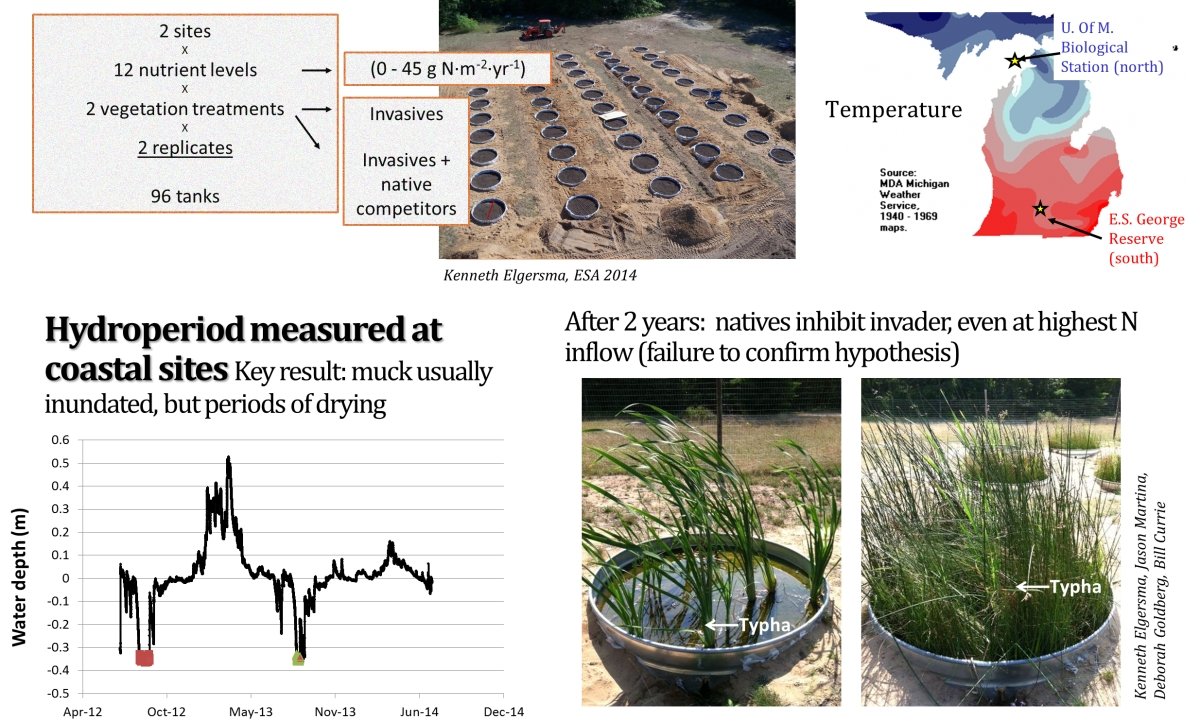
Controlled Experiment With 100 Mesocosms at Two Latitudes
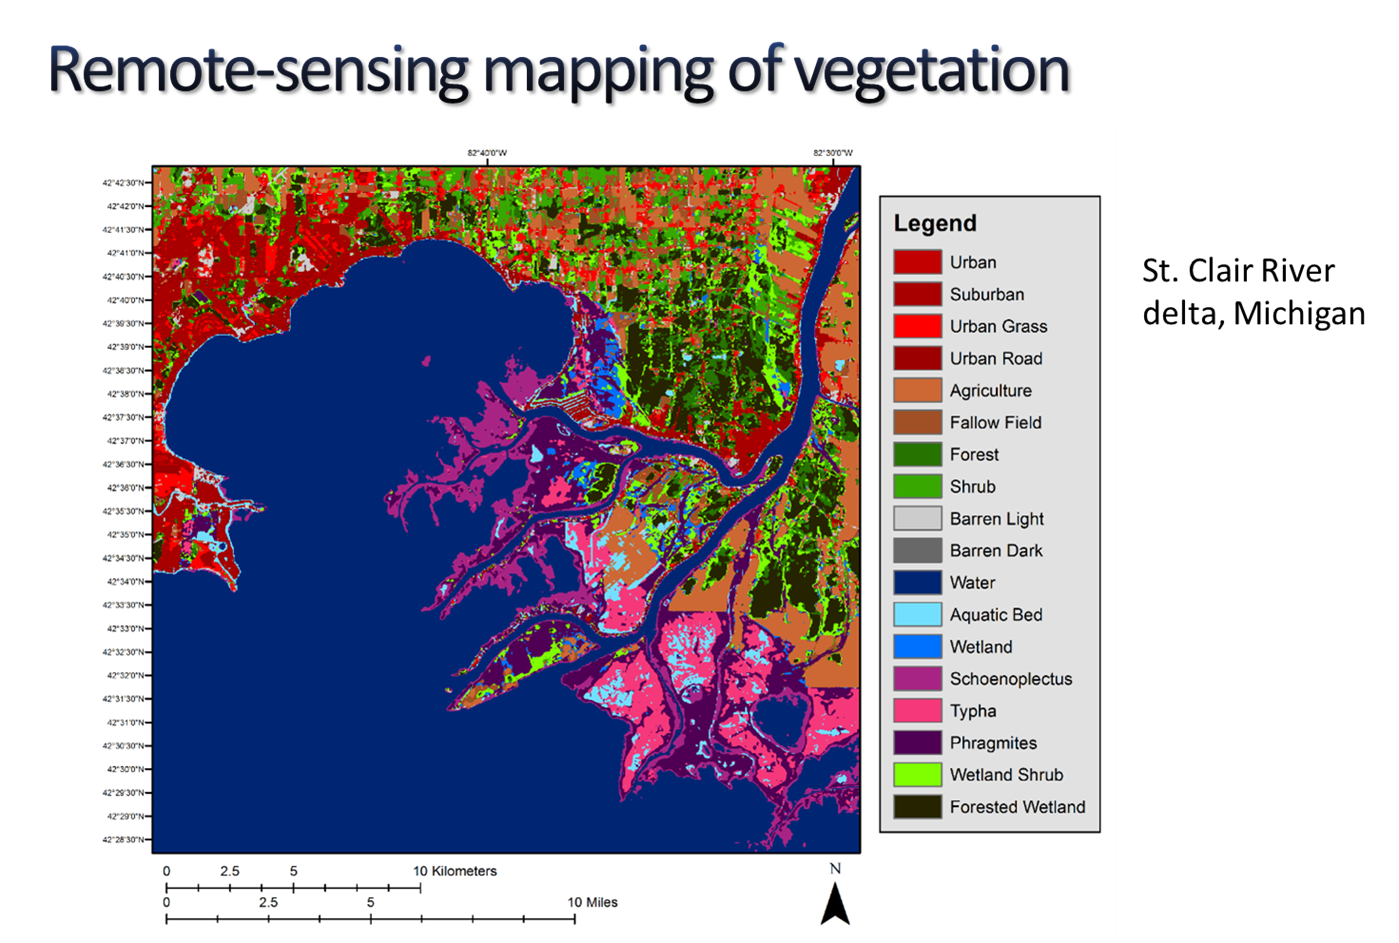
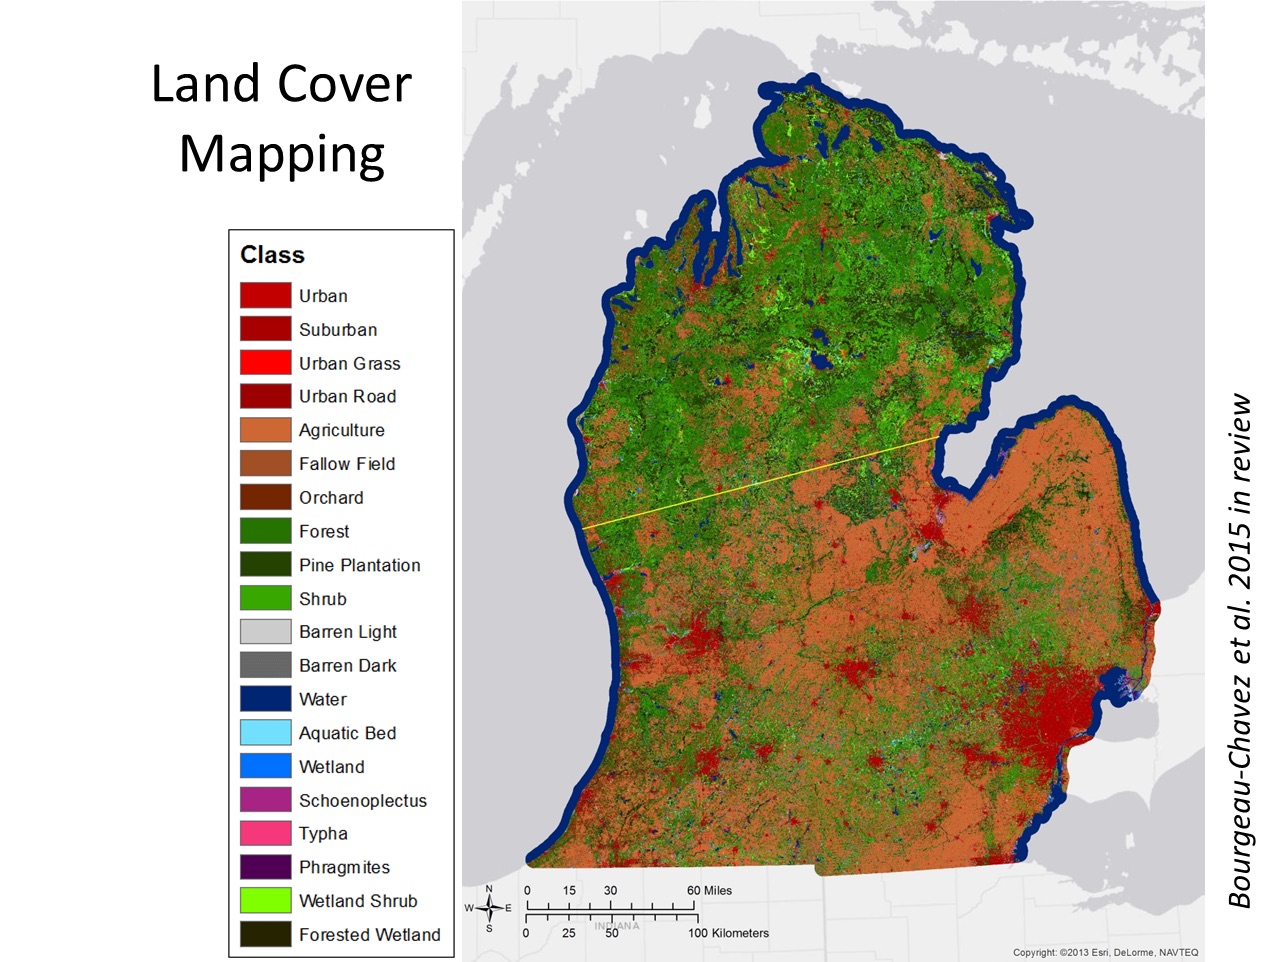
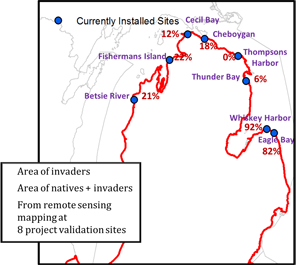
Mapping Distribution of Wetland Invaders and Land Use
Modeled Results
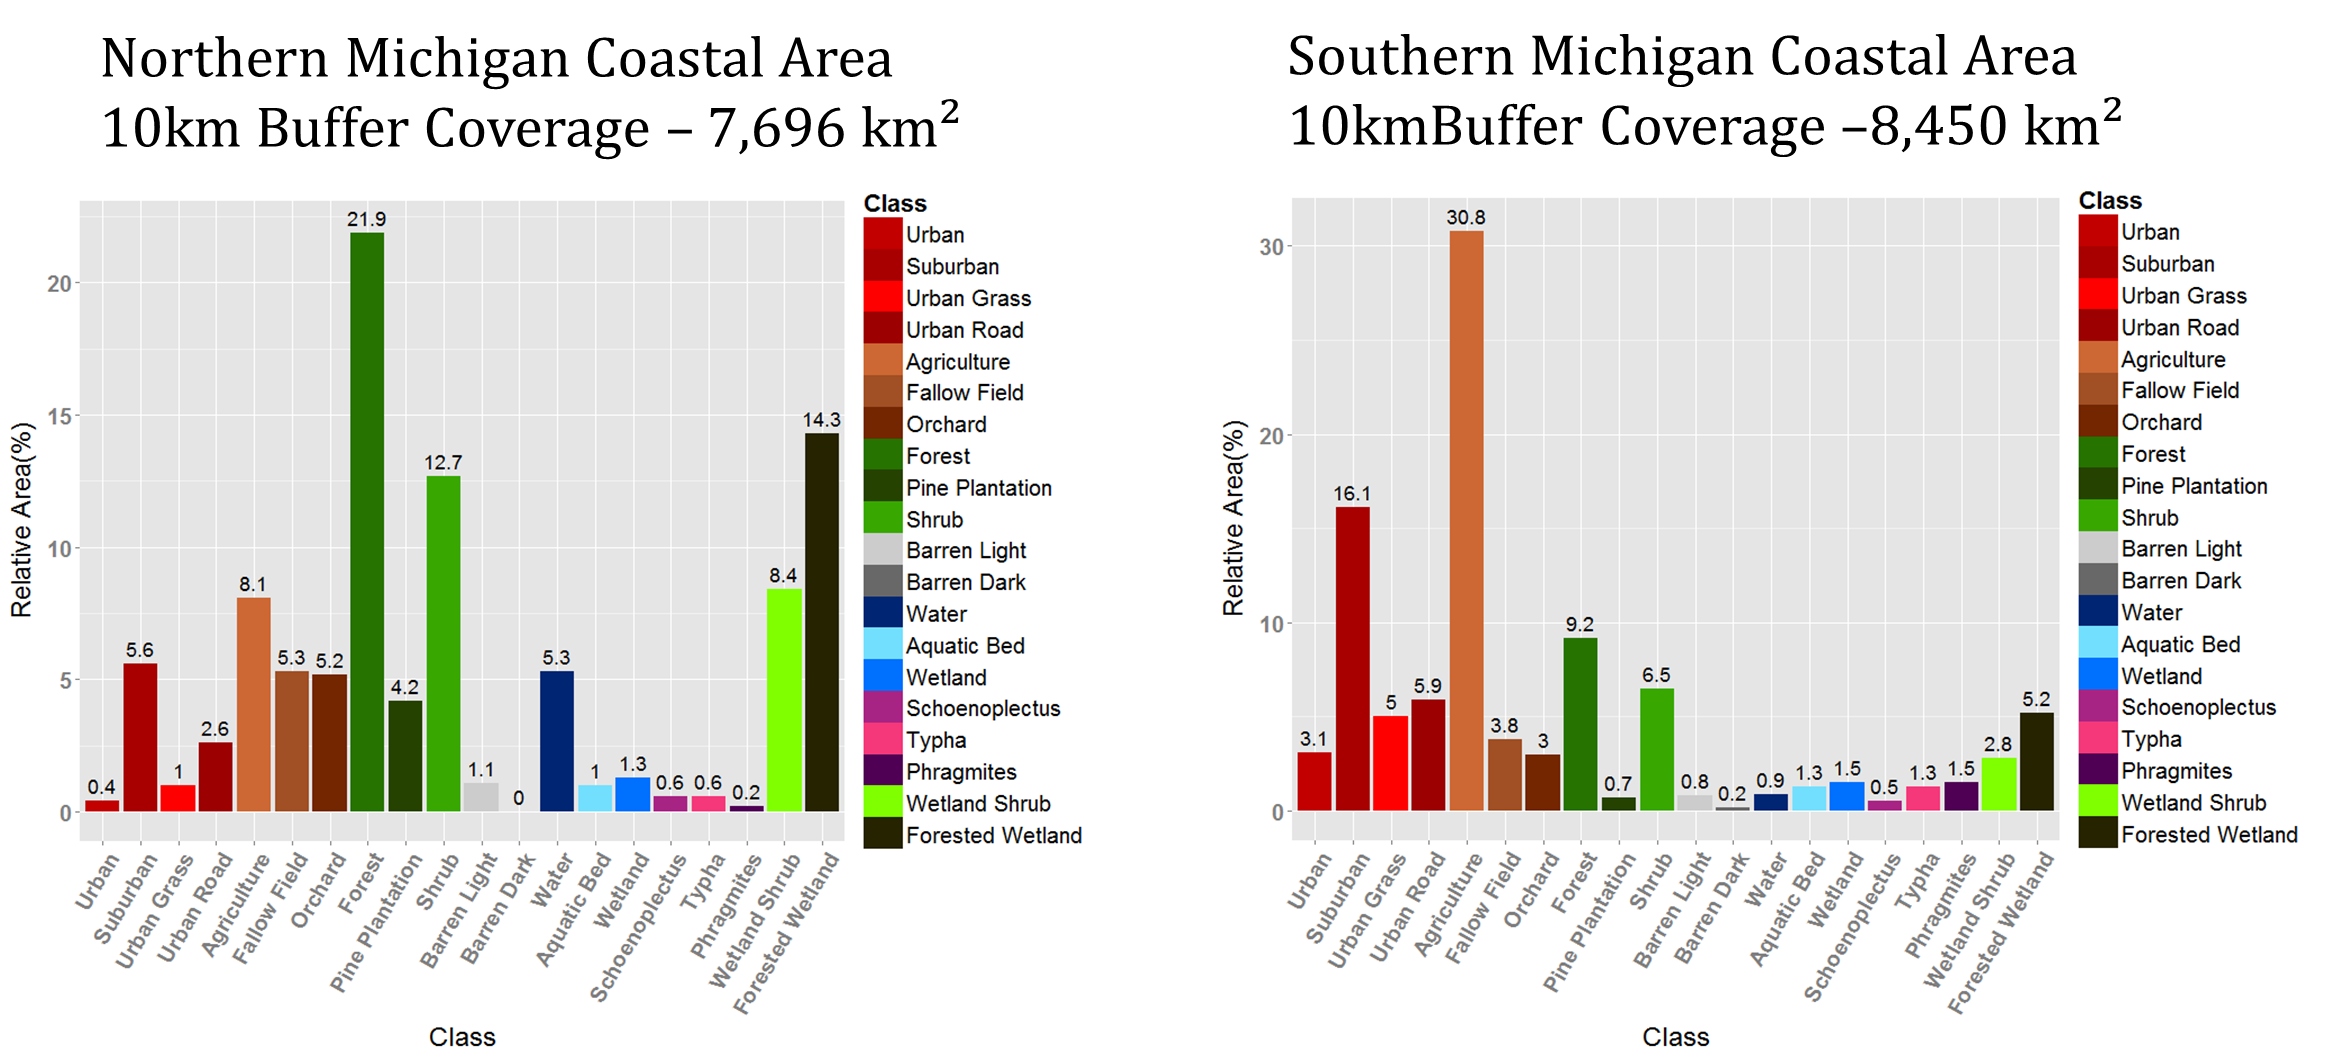
Land Use and Land Cover Analysis
Results
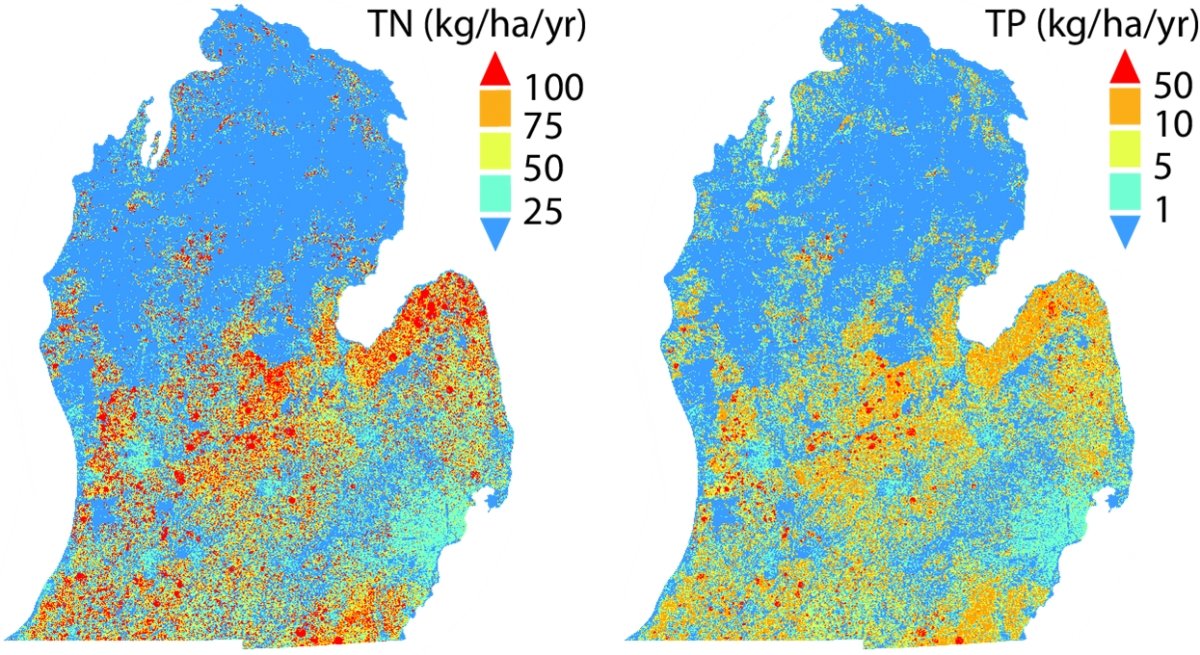
Integration of remote sensing, field data and modeled results show greater nitrogen loading and invasion of problematic wetland plants in southern half of Michigan's Lower Peninsula due to land use.
- LHM model shows greater N loading in southern half of region due to land use
- Coastal mapping shows greater plant invasions in southern half of region
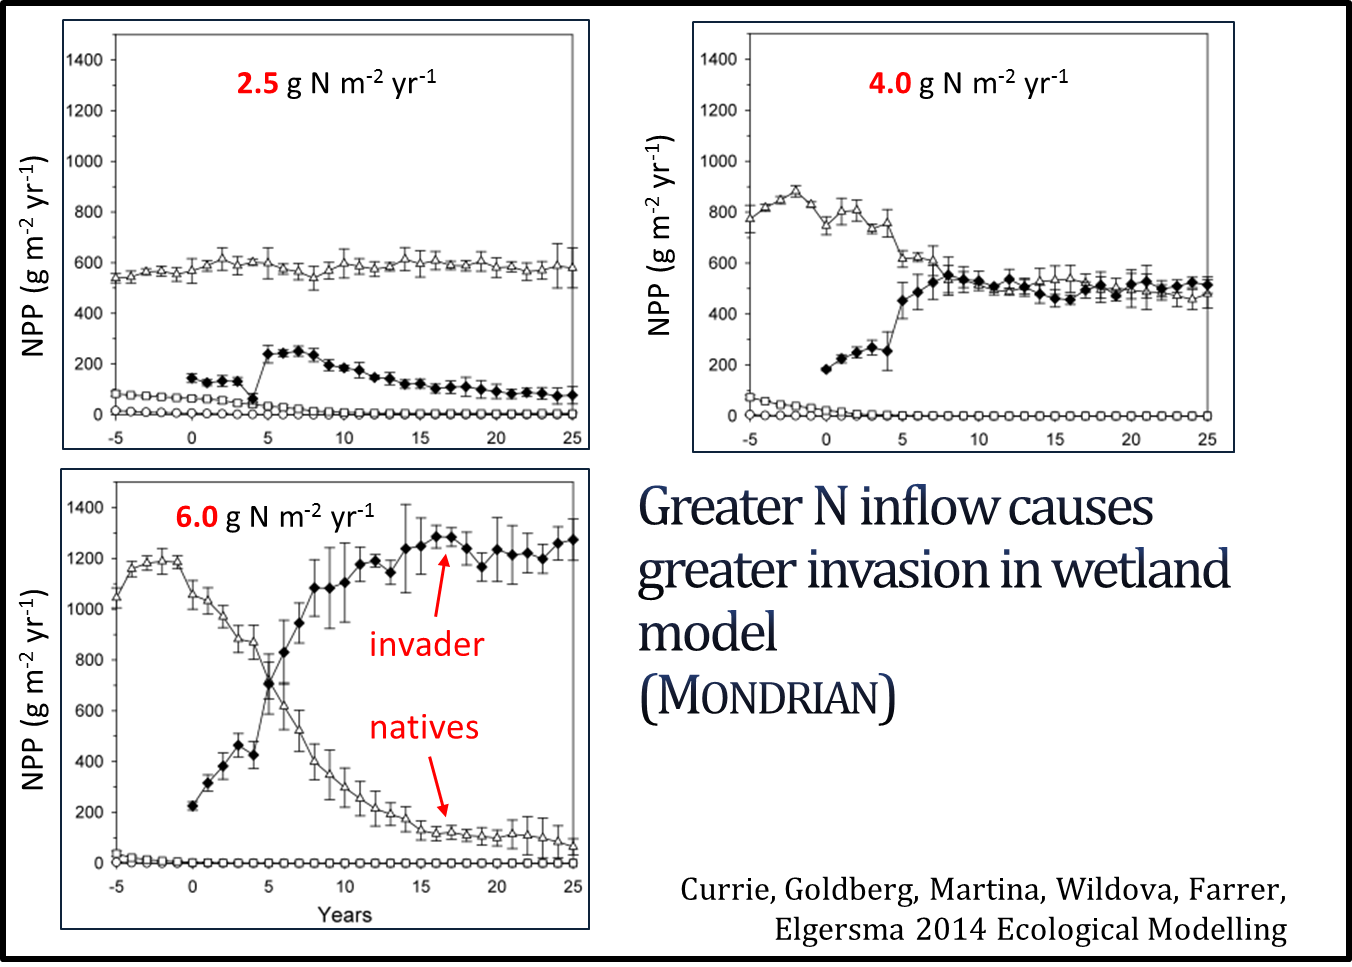
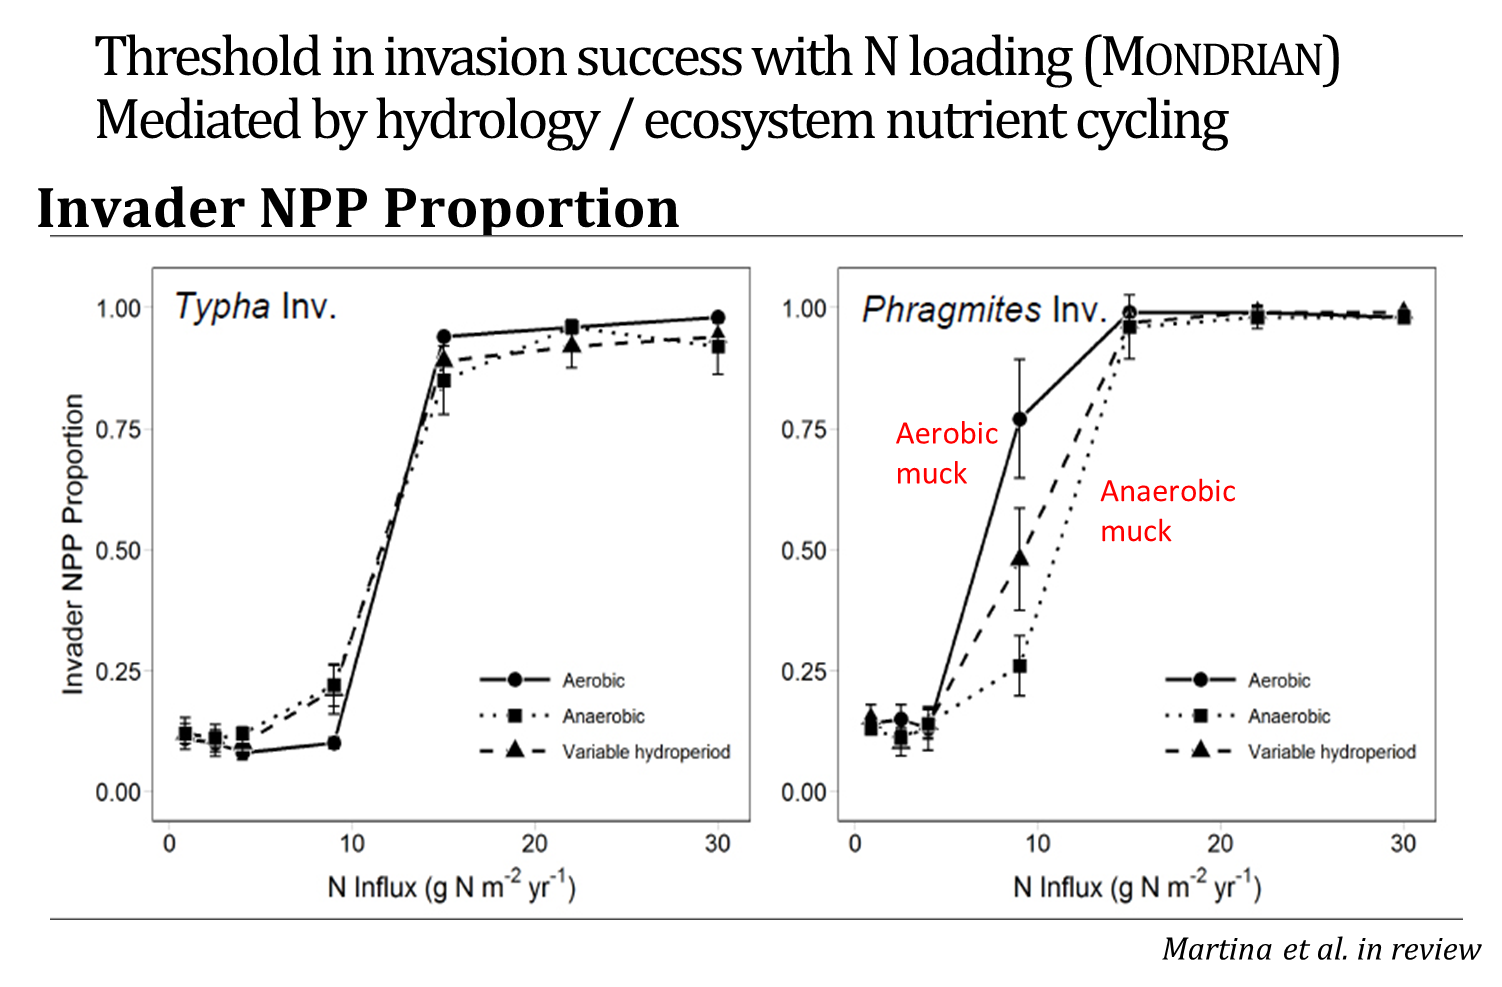
- Coastal wetland model shows how large plant size gives invaders ecological advantage when N inflows are high
- Controlled mesocosms experiment fails to confirm invasion mechanism (2 years may not be enough)
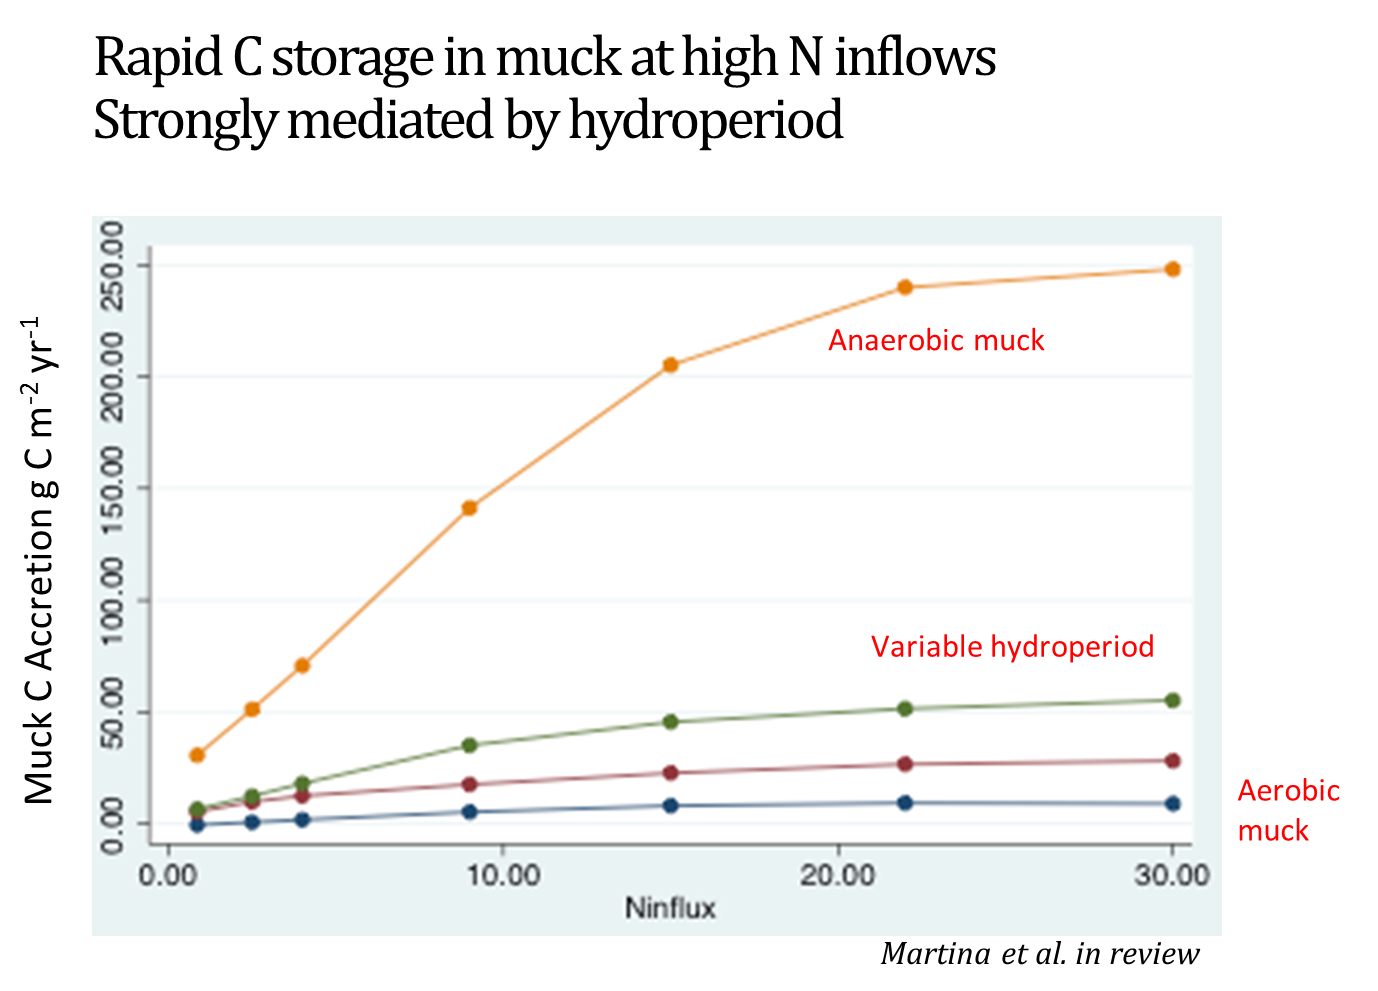
- Linked models suggest intermediate C accretion (100 gC m-2 y-1) based on hydroperiod and ecosystem processes
- Stay tuned for the “Grand synthesis:” formal model linking and validation via remote sensing and field data
Next Steps
- Run LMH Model for all watersheds
- Compare land use by watershed to model output
- Simulate Degree of Invasion using N delivery and Hydroperiod in community-ecosystem model
- Compare Simulated Degree of Invasion for each location
- Validate native and invader biomass, litter, and muck C storage for each site
- Apply validated, linked models around Michigan coast to assess invasion risk in present and future scenarios