Project Overview
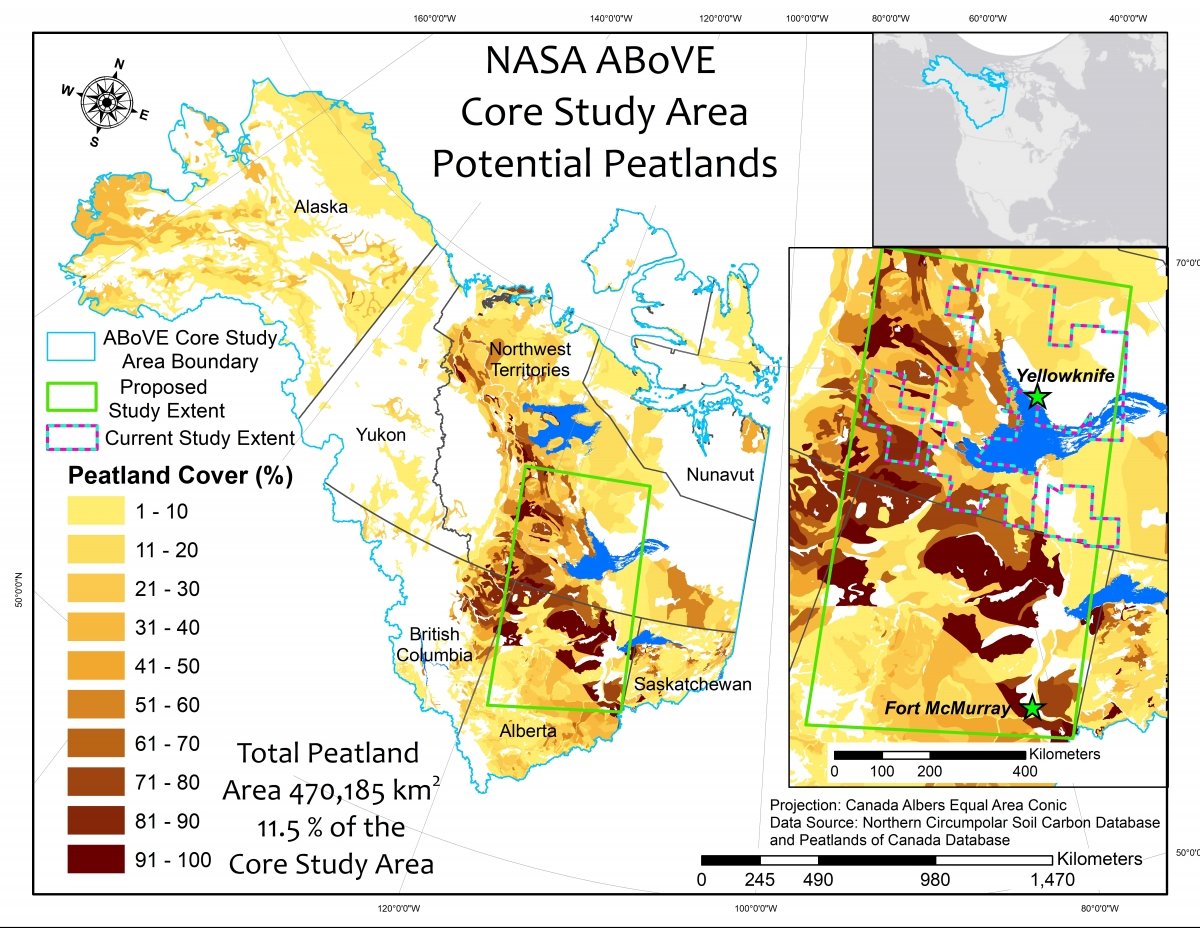
Our research in NASA ABoVE Phase I and II projects has been focused on the integration of remote sensing, spatial analysis, field data and modeling to understand the vulnerability of peatlands and uplands to wildfire across the southern Northwest Territories and northern Alberta study area where peatlands are abundant (dark browns of figure). Wildfire effects in peatland ecosystems are not well-studied and vulnerability of these systems relative to uplands is poorly understood. Ecosystem vulnerability was describes in three elements (Weiβhuhn et al 2018):
Exposure -- the probability of wildfire disturbance
Sensitivity -- susceptibility to the wildfire hazard (i.e., how severely are the ecotypes burning)
Adaptive Capacity – related to resilience (i.e., is conifer self-replacing)
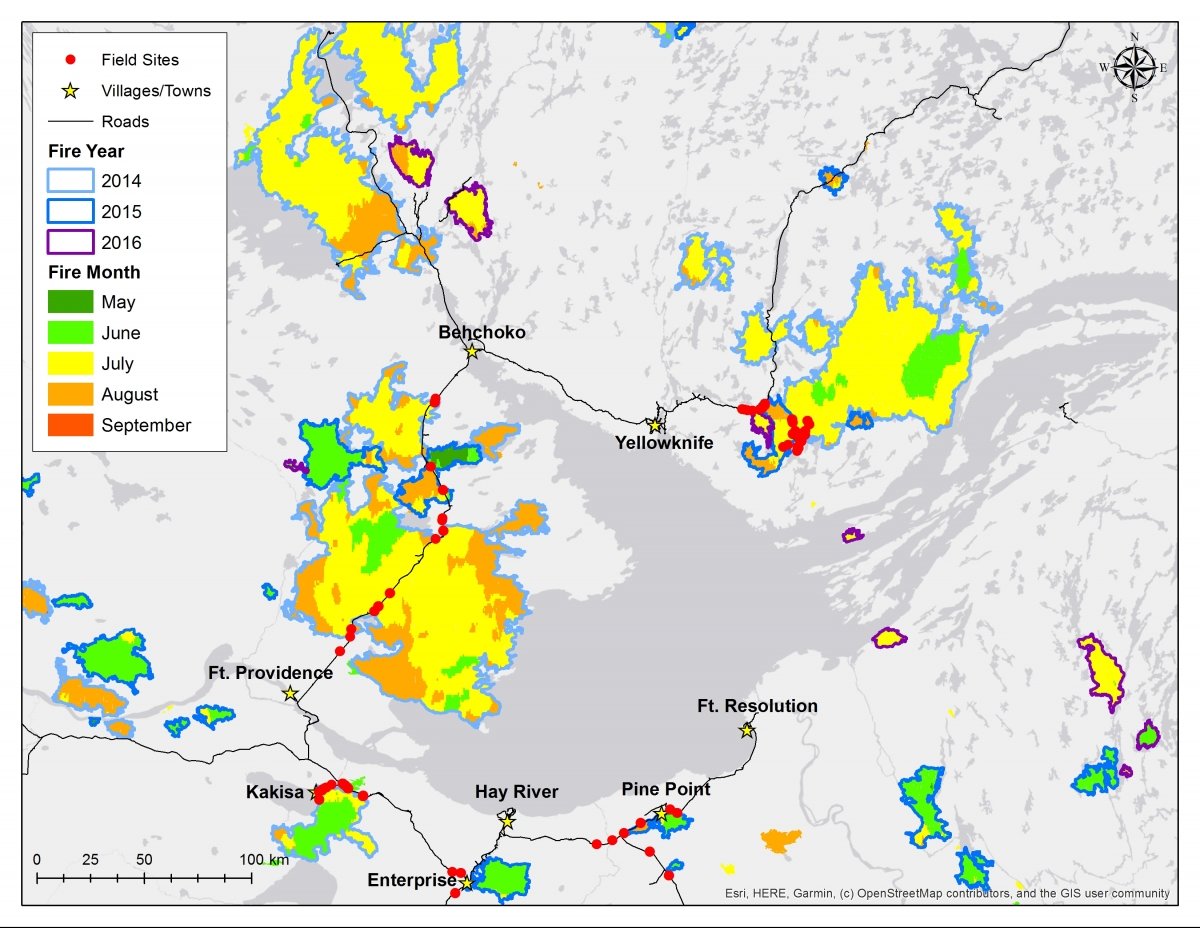
To understand how burn severity conditions vary across the landscape in uplands, lowlands and specifically in bog and fen peatlands pre-fire land cover type (including peatland and upland ecotypes) and burn severity to the organic soil (peat) layers were created and linked to field data. The intersection of these maps allowed for geospatial analysis of 142 wildfires from 2014-15 that burned over 3.3 million hectares across the study region.
 and burn severity mapping from Landsat-8 (French et al. 2020).")
The field data were used to calibrate/validate the classifications of pre-burn ecotypes based on multi-date L-band PALSAR-1 and Landsat-5 data (Bourgeau-Chavez et al. 2017) and burn severity mapping from Landsat-8 (French et al. 2020).
")
Field data were used to calibrate/validate the classifications of pre-burn ecotypes based on multi-date L-band PALSAR-1 and Landsat-5 data (Bourgeau-Chavez et al. 2017)
.")
Field data were used to calibrate/validate the classifications of pre-burn ecotypes based on multi-date burn severity mapping from Landsat-8 (French et al. 2020).
In addition, since burn severity and post-fire recovery are influenced by soil moisture conditions, a component of our study is to develop soil moisture retrieval approaches and algorithms from active microwave (SAR) imagery ( L-band UAVSAR & PALSAR-2, P-band AirMOSS, and C-band Radarsat-2 & Sentinel-1).
Field Data
Field data was collected during the summers of 2015-2019 in burned and unburned sites around the Great Slave Lake where peatlands are abundant. A total of 152 field sites were sampled by MTU including 85 burned sites and 67 unburned sites. In addition, co-I Whitman's field data from 30 additional sites in Northern Alberta and southern NWT of primarily uplands were added to our dataset.
| Ecosystem | Taiga Plain | Taiga Shield | Boreal Plain | SUM |
|---|---|---|---|---|
| Open/Shrub Fen | 18 (9) | 3 (2) | 0 | 21 |
| Treed Fen | 24 (14) | 17 (11) | 0 | 41 |
| Bog | 38 (21) | 21 (10) | 3 (2) | 62 |
| Lowland Conifer | 5 (4) | 5 (5) | 0 | 10 |
| Lowland Deciduous | 5 (0) | 0 | 0 | 5 |
| Upland | 7 (4) | 4 (3) | 0 | 11 |
| Marsh | 1 (0) | 1 (0) | 0 | 2 |
| SUM | 98 (52) | 51 (31) | 3 (2) | 152 (85) |
Patterns of Burn Severity and Post-Fire Succession
Exposure and Susceptibility to Wildfire
Questions: a) Are peatlands more or less susceptible to burning than upland areas during the extreme drought of 2014-15 NWT wildland fires? b) How does this vary by season, permafrost region, ecoregion, landform, and by year?
, and by landform (following methodology of Weiss 2001).")
Study parameters were parsed by ecoregion consisting of taiga plain and taiga shield, year by the 2014 and 2015 wildfire perimeters, permafrost region by the discontinuous and sporadic permafrost types only in the plains, season by early, middle, and late season fires (based off of fire progression maps), and by landform (following methodology of Weiss 2001).

Examples of boreal peatland types.

Example of wildfire burn severity levels.
Exposure
Results from a series of chi-squared goodness of fit tests indicate that peatlands and uplands are burning as expected given their area on the landscape on the shield (plot not shown), but preferentially on the plain. The plain results (figure below) show that for the entire area, ecotype does have an effect on area burned in the plain. It also has an effect in the sporadic and discontinuous permafrost zones and in individual fire years for the plain.
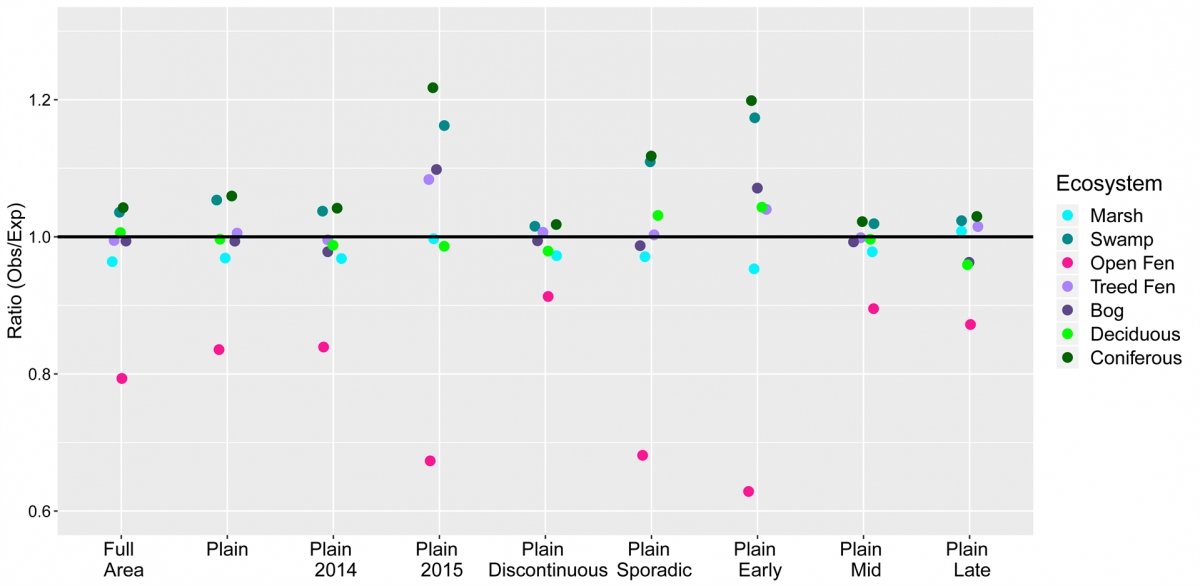
Across all parsings for the plain, upland coniferous forest and swamp forest were burning more area than expected given their availability on the landscape, and notably more in the plain in 2015, sporadic permafrost and in the early season. Open fen is burning much less than expected, even less than marsh. Deciduous forest is burning as expected for most parsings, with greater area in the plain in the early season and in sporadic permafrost, and less than expected in the late season. Treed fen and bog are burning as expected in all parsings except 2015 on the plain and the early season, where they are both burning more than expected (p< 0.05). This agrees with results of early season fires in Alberta, Canada (Bourgeau-Chavez et al. 2020).
Susceptibility
Next a set of chi-square goodness of fit tests were conducted to determine if severity of burn to the organic layer surface was occurring as expected given the distribution of severity of burn across the region when looking at the effects of ecoregion (plain, shield) and across the ecoregion for the effects of year, permafrost, season, and landform. Note that the shield region of study only had a single permafrost zone, so it was not tested for effect of permafrost. All of the chi-square tests picture below were significant except the late season shield.

Ecoregion: Burn severity on the shield was quite different than on the plain, with much more light burn than expected on the shield, and much less unburned area and severe burn area. In contrast the plain showed much more severe burn and unburned area than expected.
 while the lowland types (bogs, fens) were burning less than expected in the moderate to severe burn categories.")
Ecosystem Type: Burn severity by ecosystem types was preferential with upland conifer burning much more severely (moderate and severe categories) while the lowland types (bogs, fens) were burning less than expected in the moderate to severe burn categories.
 Shield: In comparison of the two fire years, on the shield much more area was moderate to severely burned than expected in 2015 and less area burned severely than expected in 2014.")
Year (1/2) Shield: In comparison of the two fire years, on the shield much more area was moderate to severely burned than expected in 2015 and less area burned severely than expected in 2014.
 Plain: Meanwhile the opposite occurred on the plain, with much less area burned severely in 2015 than expected and more area than expected burned severely in 2014.")
Year (2/2) Plain: Meanwhile the opposite occurred on the plain, with much less area burned severely in 2015 than expected and more area than expected burned severely in 2014.
Season (1/2) Shield: Severity of burn was as expected in the late season for the shield (not significant chi-square test), but significantly different for the early and mid-seasons. In the early season more severe burns were occurring.
 Plain: In contrast, on the plain in the early season more area was unburned or singed than expected and much less area was moderately to severely burned.")
Season (1/2) Plain: In contrast, on the plain in the early season more area was unburned or singed than expected and much less area was moderately to severely burned.

Permafrost: For the plain, permafrost does appear to have an effect on severity of burn, where sporadic permafrost had much more area unburned than expected compared to fires in discontinuous permafrost, and also less area than expected in light and moderate severity, but severe burn was similar.
. Below only the significant (p<0.05) differences are shown for the shield and plain. Two key results are that the regional-low depressions have much more area left unburned than expected on both the shield and plain, but on the shield these landforms are also showing more area in the severe burn class than expected. On the plain regional high ridges and flat areas have more area burned in the high severity class than expected while these areas show less than expected area burned severely for the shield.")
Landform: When looking at the effect of landform on the burn severity, landscape position with a regional high, flat and low and then a depression, flat area or ridge within those regional positions were compared (i.e. 9 landforms). Below only the significant (p<0.05) differences are shown for the shield and plain. Two key results are that the regional-low depressions have much more area left unburned than expected on both the shield and plain, but on the shield these landforms are also showing more area in the severe burn class than expected. On the plain regional high ridges and flat areas have more area burned in the high severity class than expected while these areas show less than expected area burned severely for the shield.
Adaptive Capacity - Resiliency
Questions: a) How do pre-fire conditions and fire severity influence patterns of vegetation succession after fire? b) Under what conditions do we see vegetation recovering to its pre-fire composition vs. shifting to a new state?
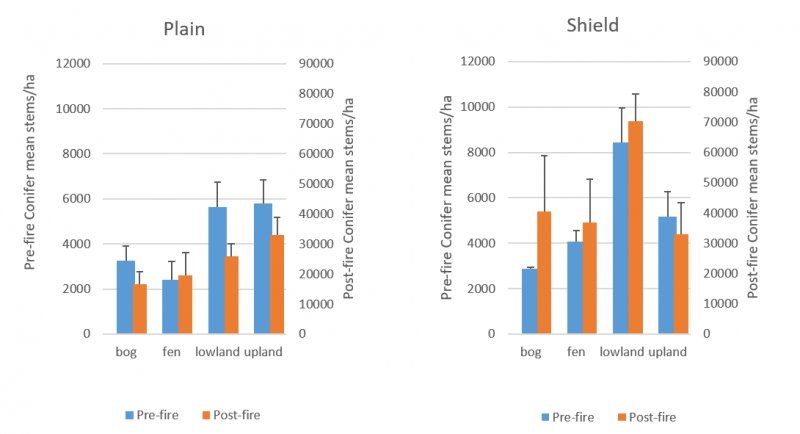
We focused on field data collected on post-fire regeneration in year 4 for 53 one hectare study sites. Review of our tree-recruitment data and pre-burn tree density (plotted below) shows, for our primarily lowland field sites, that conifer tree recruitment is strong across all sites, with the shield showing higher pre-fire tree densities and the highest tree recruitment.
We combined our 53 sites of predominantly peatland data with 30 primarily upland sites from collaborator Whitman who used similar sampling techniques. Analysis of pre- and post-burn dominance across all 83 sites without reference shows a 33% conversion from conifer dominance pre-fire to deciduous, mixed or shrub post-fire across upland and lowland ecotypes.
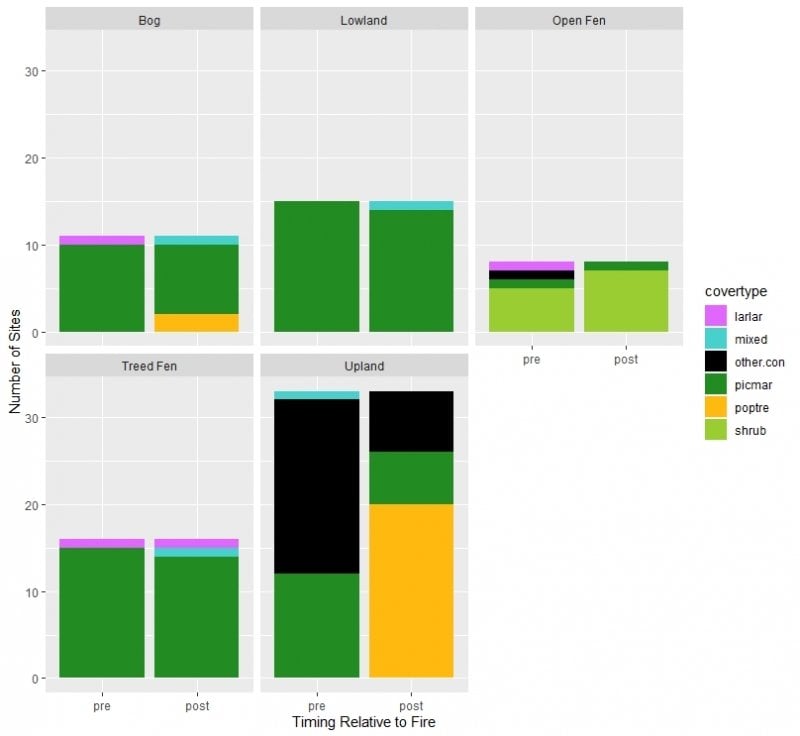
Dominant species cover type was determined by greatest basal area pre-burn and stem density for post-burn with a minimum of 50% of the total basal area or stem density. With the integrated data, 20 of the 33 upland sites are converting to broadleaf post-fire, 1 was a mix of deciduous and coniferous pre-fire. Two additional bogs are converting to deciduous post-fire. Another 3 lowland (bog, fen, lowland) are converting to mixed coniferous/deciduous. The rest are remaining conifer.
 with sites categorized into self-replacement, competition (co-dominant species), poor establishment (low recruitment) and regeneration failure (no seedlings of pre-burn dominant species) for all 83 sites indicated that 71% of sites dominated by black spruce (picmar) pre-fire are self-replacing, while only 41% of jack pine (pinban) were self-replacing, the few white spruce and tamarack dominated sites pre-fire were not self-replacing and the two deciduous sites were self-replacing (poptre).")
An analysis of post-fire succession using the framework of Baltzer et al. (2020) with sites categorized into self-replacement, competition (co-dominant species), poor establishment (low recruitment) and regeneration failure (no seedlings of pre-burn dominant species) for all 83 sites indicated that 71% of sites dominated by black spruce (picmar) pre-fire are self-replacing, while only 41% of jack pine (pinban) were self-replacing, the few white spruce and tamarack dominated sites pre-fire were not self-replacing and the two deciduous sites were self-replacing (poptre).
. Plain and wetlands ( p < 0.1 ).")
Chi-square analysis shows that resiliency is affected by whether a site is an upland vs. wetland and on plain vs. shield for these extreme dry years. Here wetlands and the shield have more sites self-replacing than the uplands and plain. Shield and upland (p < 0.5). Plain and wetlands ( p < 0.1 ).
Soil Moisture – Soil Drainage
Several variables affect the recovery of a landscape from wildfire, setting the stage for what successional trajectory the site will take. Soil moisture and drainage conditions are important for determining whether the site will have enough moisture or too much or too little moisture, thus influencing the success of tree recruitment. Sentinel-1 C-band SAR data allow for assessment of soil moisture using time series analysis of backscatter.
A time series example for the 2014 burned area, SS-03, on the Plain of Northwest Territories near Kakiska shows the dynamic changes in C-band backscatter that can be related to soil moisture condition (note the April 2016 image is from frozen condition and was removed from the analysis).
 for SS-03 Area")
Sentinel-1 Time Series (2016-2018) for SS-03 Area
")
The location map of SS-03 (red outline)
The theory is that well drained sites will have high backscatter after a rainfall but quickly return to lower backscatter while more poorly drained sites will maintain higher backscatter and respond less strongly to rainfall.
Principal component analysis was applied to the Sentinel-1 time series to produce a soil "drainage" map of the SS-03 wildfire. Previous research found the second principal component image to be related to moisture (Bourgeau-Chavez et al. 2007). Below, the PC-2 image is level-sliced based on field data to determine wet to dry soil drainage conditions. These maps will help inform models of post-fire succession.
 and Sentinel-1 drainage map (right)")
Side-by-side maps of PC-2 output image (left) and Sentinel-1 drainage map (right)

PC-2 output image

Sentinel-1 drainage map
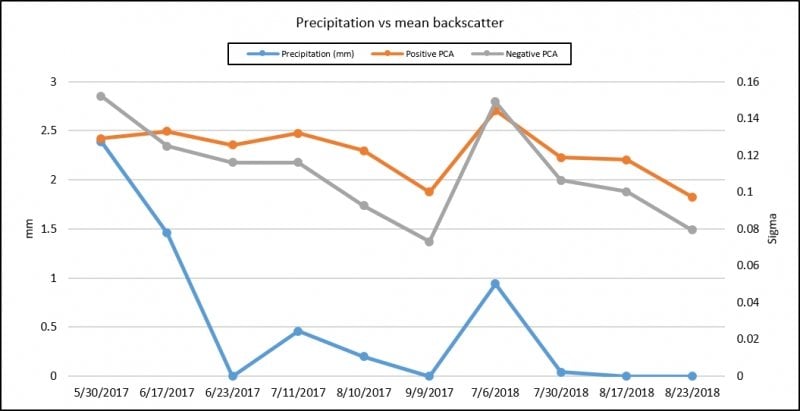
Comparison of rainfall from the Hay River weather station plotted against mean backscatter for areas with positive PC values along with mean backscatter from areas with negative PC values. This is a validation of the map showing that positive PC values are showing areas that are moisture with higher backscatter and more of a steady response to rainfall, while negative PC values are more strongly affected by rainfall but then return to lower backscatter and more of a steady response to rainfall while negative PC values are more strongly affected by rainfall but then return to lower values.
Modeling Interactions Between Hydrology and Wildfire
Work is underway to calibrate and validate ecosystem, hydrology and fire effect models (FATES, CLM-HH, and CanFire) for lowlands (peatlands) and uplands. Then modeling will be used to improve understanding of the interactions between wildfire and hydrology on carbon emissions, post-fire successional trends, and conduct projections based on expected future climate scenarios.
Work is underway to calibrate CanFIRE for peatlands using field and remote sensing data from this project and to apply it geospatially. Currently only upland forest above- and below-ground fuel loadings are modeled. CanFIRE is a compilation of Canadian fire behavior models used to capture immediate physical fire effects on stand characteristics and simulate later ecological effects on stand composition (de Groot, 2009).
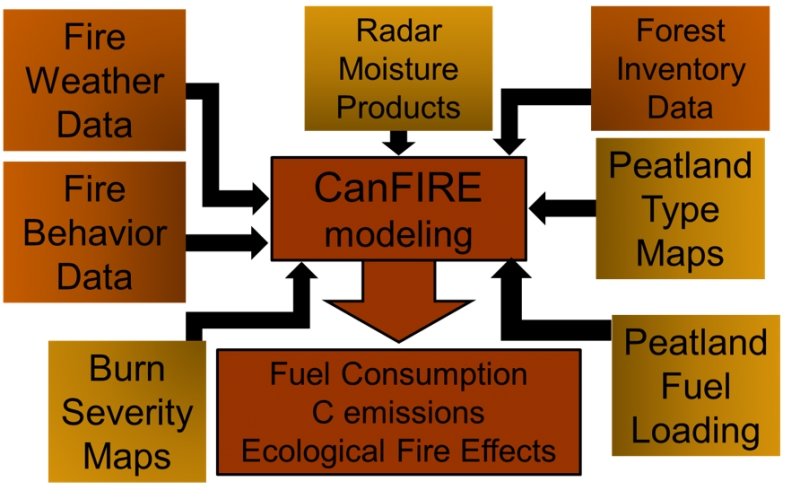
Schematic Overview of Fuel Consumption and Emissions Modeling
The orange boxes show data that are used in the current version of CanFIRE, yellow boxes represent project outputs for calibration of the model to include peatlands.
FATES is an open source dynamic terrestrial ecosystem model that uses plant traits to predict resource competition, tree structure and distribution, and disturbance dynamics. It has been integrated for this project with CLM-HH sub-grid hydrology hillsloped and lateral subsurface flow model and SPITFIRE (fire behavior and effects model). The combined FATES-CLM-HH model simulates vegetation and permafrost response to site, climate and fire.
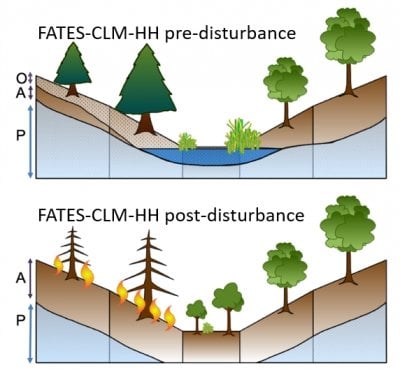
Integrated FATES-CLM-HH Conceptual Diagram