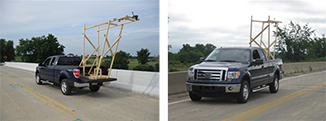
3DOBS is an easily deployable bridge evaluation system (Figure 1) used for rapidly assessing surface condition indicators such as the area, volume, and location of deck spalls and scaling. The original version of the system consists of a vehicle-mounted digital SLR camera, such as a Nikon 5000, that takes frequent, regularly-spaced pictures as the vehicle drives across the bridge. A newer version is under development to use advanced high frame rate cameras so that bridge condition data can be collected at near highway speeds. Overlapping digital imagery enables creation of very high-resolution 3-D models of the bridge deck surface. To assess one standard 12-foot (3.7m) lane width per collected pass, the cameras have been set at a height of 9 feet (2.7m) above the bridge deck.
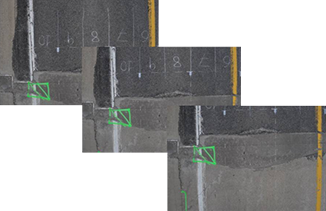
Photographs collected in the field (Figure 2) are processed with close-range photogrammetry software, into a high-resolution 3-D model of a lane. A Digital Elevation Model (DEM) is then created after adding reference points and setting up a coordinate system. A merged DEM for the entire bridge is created using GIS software.
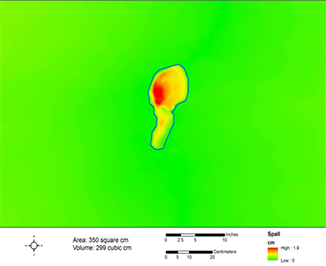
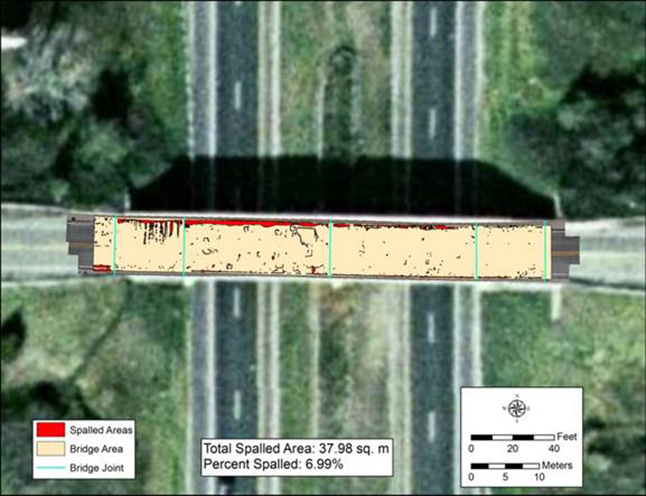
After a merged high-resolution DEM is generated, it is then analyzed with GIS to map the volume, location, and area of spalls across the bridge deck surface. Individual spalls are characterized and the total percent spalled for a bridge deck surface is calculated automatically (Figure 3).
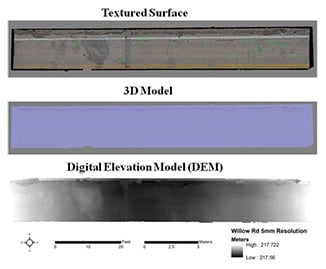
Figure 4 is an example of automatically mapping spalls for a bridge using 3DOBS data: the red areas indicated spall locations on the bridge, which total 6.99% of the bridge area. This provides a critical indicator on the condition of the bridge surface using a low-cost system. These data can be integrated into existing and new transportation Decision Support Systems (DSS).
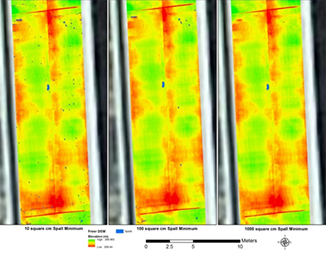
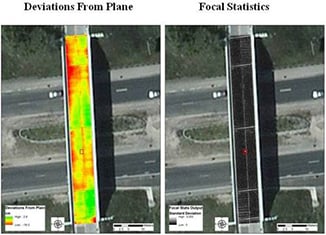
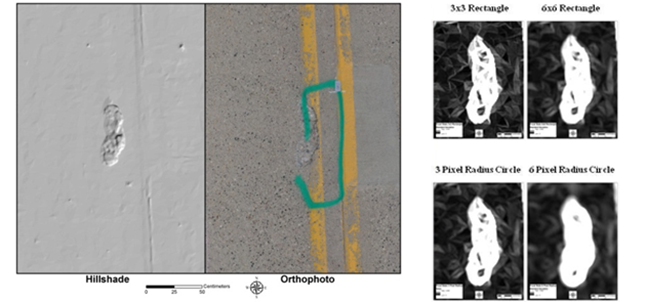
As shown in Figures 5 and 6, 3DOBS uses neighborhood analysis on the DEM to determine the change in cell values. This enables automated spall detection.
3DOBS is available for immediate deployment by transportation agencies to assess the surface conditions of their bridges, in collaboration with MTRI. 3DOBS is a low-cost system for 3-D data collection compared to alternatives such as LiDAR.