Introduction and Summary
Federal, state, county, and local municipalities have a growing concern over water quality issues. Public beaches along the Great Lakes have experienced an increase in closures over the last decade due to pollution. To address the public’s concern in respect to safe beaches, many county health organizations have dramatically increased their water quality sampling efforts.
The MTRI Lake St. Clair watershed data management system was an Internet web/portal-based water quality information management system. Our system combined IBM QuickPlace (web/portal) geographic information system (GIS), Microsoft Excel documents, and SQL Server (relational database) technology to inventory, perform quality control, analyze, approve release, and disseminate data to government, industry, academia and the public. The system had password protection so that parts of the system are accessible by the public, while other parts that contain sensitive data are protected. A part of the portal addressed outreach and education, which proved to be invaluable in explaining the measured water quality values to the public.
Lake St. Clair Watershed Data System
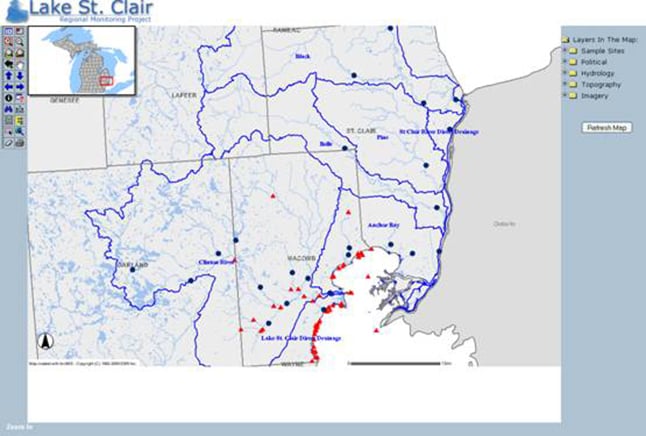
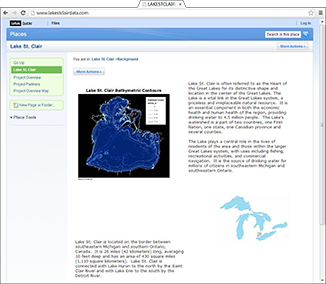
In 1997, as a result of a growing concern about water quality issues, the Macomb County Board of Commissioners established a Blue Ribbon Commission on Lake St. Clair. That Commission’s report identified the watersheds of the Clinton and St. Clair Rivers as having a direct impact on Lake St. Clair and made recommendations for enhanced monitoring within Macomb, Oakland, St. Clair, and Wayne counties. The Lake St. Clair Regional Monitoring Project is acquiring stream flow and water and sediment quality data over the 2004 and 2005 sampling seasons, with emphasis on the effects of major storm events. To manage the large amount of data, the Lake St. Clair Watershed Data Management System was created by MTRI (Figure 1).
The project included continuous water quality monitoring at 13 fixed stations; automatic and manual grab sampling during 10 rainstorms; continuous and manual stream flow measurements at 23 locations (see Figure 2), and rainfall monitoring at 5 locations to augment the existing rain gauge network. Samples are being analyzed for numerous physical, chemical, and biological parameters. These environmental monitoring efforts:
- Constituted a more comprehensive assessment of water quality
- Determined contaminant loadings to Lake St. Clair and its tributaries
- Characterized the relationship between sediment concentrations and water quality
- Better described the impacts of land uses and subsequent storm water runoff
- Potentially identified currently unknown point source discharges