Due to the increased number of extreme weather events in recent years, MTU and MTRI are working to update frequently used data sets for hydrologic calculation procedures, as well as to evaluate new procedures for potential operational use. Inaccurate design discharge estimation leads to reduced reliability of drainage and flood conveyance systems and sub-optimal allocation of scarce funding. MDOT will participate in project meetings and provide advise on direction of the project.

Left: Houghton 2018 Father’s Day Flood (image courtesy of the National Weather Service).
Right: Michigan Tech UAV photo of the former location of the Edenville dam, taken two weeks after the historic May 2020 flood event that also destroyed the Sanford Dam and M-30 bridge over Wixom Lake.
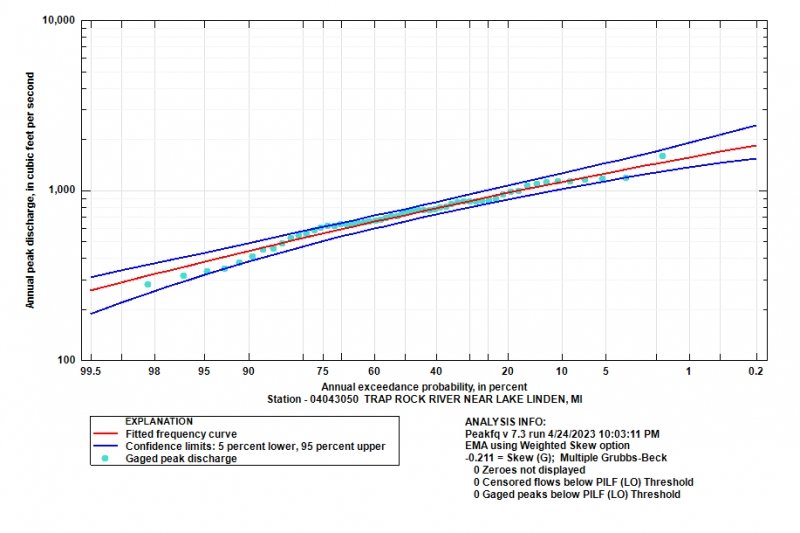
The goals of this project are to incorporate modern data sets to improve calculated
results and to develop alternative methods to calculate recurrence interval peak discharges
at ungauged sites. After interviewing MDOT and EGLE staff to understand current prediction
methods and their application, project focus will shift to updating and validating
the methodology for small basins.
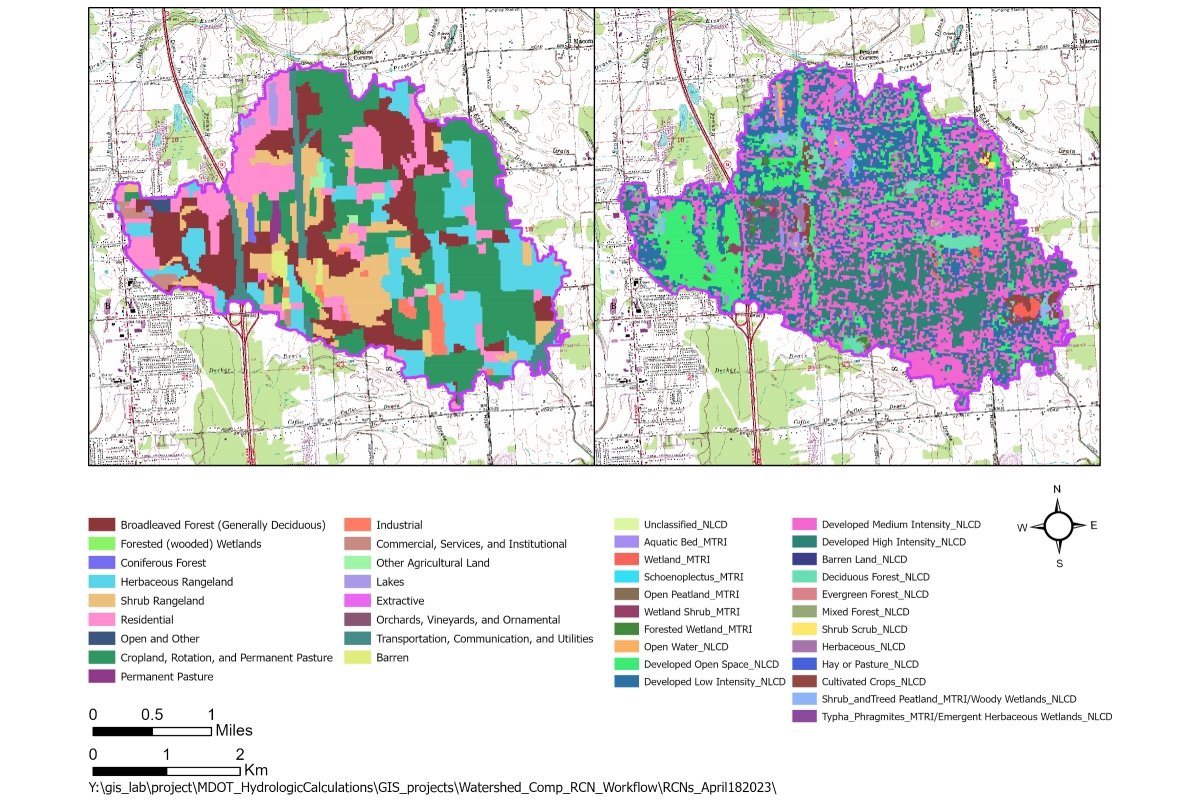
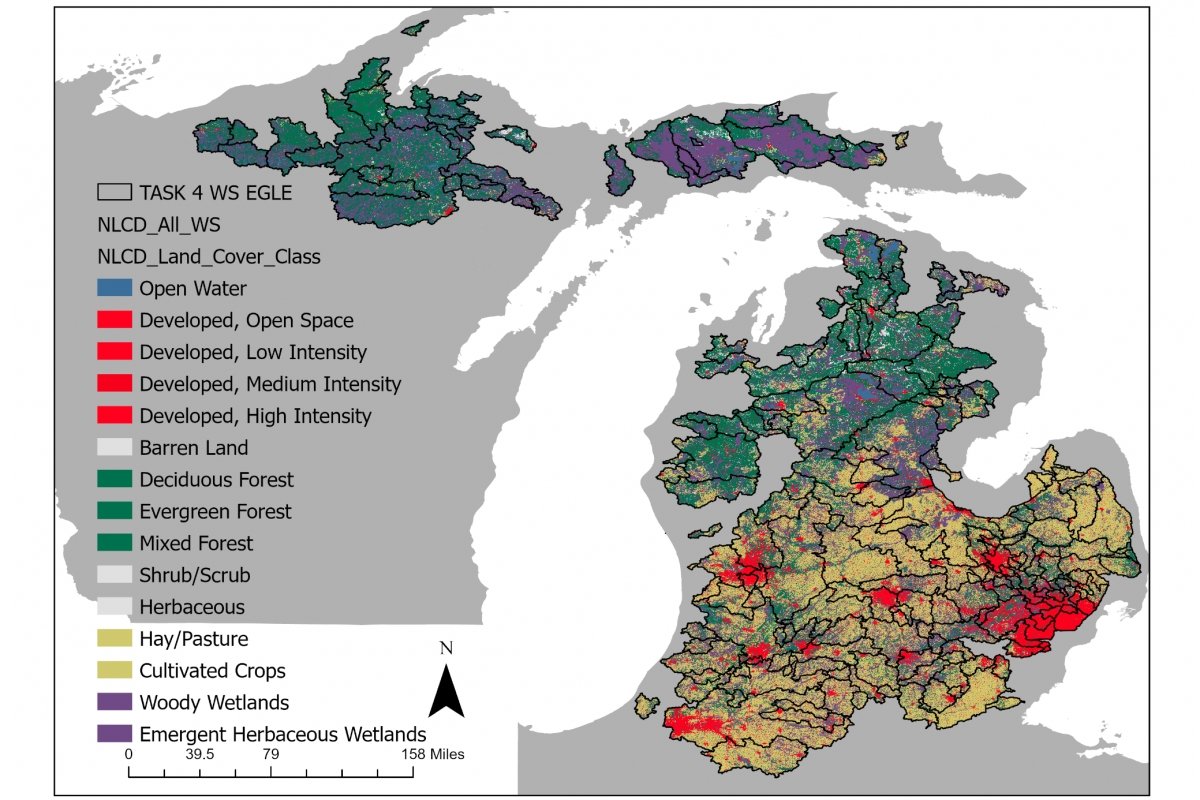
To accomplish this, the team will analyze GIS data for SCS curve numbers and evaluate
data sets for automated workflows. Afterwards, regions will be updated taking into
account regional differences in climate. This data will be used to create a new standalone
software tool for applying the updated regression equations.

Finally, development of an implementation action plan, a training event and materials, and the final report will conclude this project.