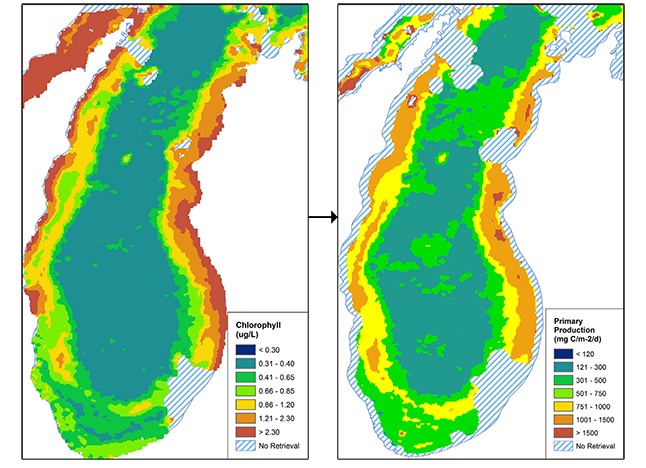
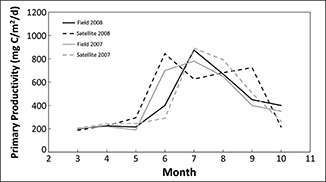
MTRI has developed a new primary production model for the Great Lakes using satellite data as the primary input. The Great Lake Primary Productivity Model (GLPPM) was developed under the NASA ROSES Carbon Monitoring System Program as well as under Great Lakes Observing System (GLOS) funding to help determine if and when the Great Lakes act as sources or sinks of carbon to the atmosphere. The GLPPM uses satellite-retrieved concentrations of chlorophyll a, Photosynthetically Available Radiation (PAR), and light extinction from the MTRI Color Producing Agent Algorithm (CPA-A) (Shuchman et al. 2013). The model also utilizes Photosynthetic Irradiance (PI) parameters derived from years of consistent field observations to estimate phytoplankton carbon fixation rates. The model is the next generation implementation of the model proposed by Fee (1973) and Lang and Fahnenstiel (1996). The GLPPM has been tested with in situ model estimates (Fahnenstiel et al. 2010) and displayed good agreement throughout the vegetative season (Shuchman et al. 2013).
Initial yearly estimates of carbon fixation for each of the Great Lakes have been estimated using the satellite based GLPPM. Estimates for 2008 total carbon fixation of each lake are: Lake Superior - 4.3 Tg C/yr; Lake Michigan 5.0 Tg C/yr; Lake Huron 4.5 Tg C/yr; Lake Erie 14.0 Tg C/yr; Lake Ontario 3.4 Tg C/yr. The total carbon fixation for all of the Great Lakes in 2008 is approximately 31 Tg C/yr. These estimates were generated under NASA Roses CMS funding (award no. NNX12AP94G).
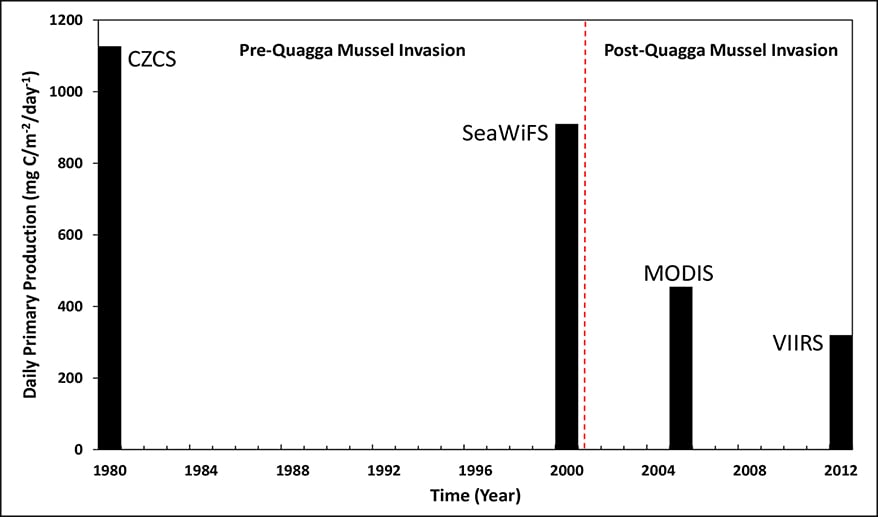
Spatially varying time series estimates of Great Lakes primary production are possible with the use of satellite water color imagery dating back to 1979. Using this imagery an approximate 70 percent decrease in average Lake Michigan primary production has been observed since 1980. The decrease from 1980-2000 is partially due to the Great Lake Water Quality Agreement (GLWQA), however the very large decrease from 2000–present is due to the large scale introduction of Dreissenid mussels (Zebra and Quagga).
The GLPPM allows for detailed annual and intra-annual spatial analysis of the Great Lakes lower food web as well as helping to refine estimates of the total Great Lakes carbon budget. This satellite-based approach is an improvement on spatially and temporally limited in situ sampling efforts that are not able to capture the lake wide variability in primary production.
References
Fahnenstiel, G., Pothoven, S., Vanderploeg, H., Klarer, D., Nelapa, T., Scavia, D., 2010b. Recent changes in primary productivity and phytoplankton in the offshore region of southeastern Lake Michigan. J. Great Lakes Res. 36 (3), 20–29.
Fee, E.J., 1973. A numerical model for determining integral primary production and its application to Lake Michigan. J. Fish. Res. Board Can. 30, 1447–1468.
Lang, G.A., Fahnenstiel, G.L., 1996.Great Lakes Primary Production Model — Methodology and Use. NOAA Tech. Memo. ERL GLERL-90. NOAA Great Lakes Environ. Lab, Ann Arbor, MI.
Shuchman, R.A., Sayers, M.J. and Brooks, C.N., 2013. Mapping and monitoring the extent of submerged aquatic vegetation in the Laurentian Great Lakes with multi-scale