
Using geographic information systems (GIS) and archaeology to model industrial hazards in postindustrial cities to guide planning and development.
More people live in cities than in rural areas for the first time in human history. But cities aren’t unchanging edifices; they expand and contract, their demographics shift and their leaders write policies with positive and negative effects on different people.
Grants and Funding
Social Science and Humanities Research Council of Canada Standard Research Grant, Social Science and Humanities Research Council of Canada Vanier Canada Graduate Scholarship, National Endowment for the Humanities Collections and Reference Resources (Grant # PW-234885-16) and the Michigan Space Grant Consortium Graduate Fellowship.
Cities in the Rust Belt — a geographic area largely concentrated around the Great Lakes in the U.S. and Canada — have been particularly hard-hit by recessions, changing technology and accelerated automation of industrial jobs. Many cities in the area have fully transitioned to postindustrial economies. Yet this evolution doesn’t wipe clean the slate of history or of communities and architecture.
And of great consequence to policy makers and planners, city adaptation sometimes blurs understandings of where industrial hazards might lie. In the Rust Belt, schools have been sited where factories sat, exposing children to heavy metals and asbestos. Waterfronts have been redeveloped into parks, only to discover toxic “forever” chemicals like PFAS are present in the water.
It’s said those who do not learn from history are doomed to repeat it. Combining historical spatial data infrastructures and archaeology can aid cities in redeveloping safely to avoid potentially harmful exposure.
Dan Trepal
Research Interests
- Industrial Archaeology
- GIS and Spatial History
- Postindustrial Landscapes
Michigan Technological University researchers have developed a GIS-based model to identify the persistence of industrial hazards in postindustrial cities. Dan Trepal, a postdoctoral researcher and Don Lafrenière, associate professor of geography and GIS, both in the Department of Social Sciences, examined human risk of exposure to environmental hazards in postindustrial London, Ontario, through space and time, but the spatial-temporal model can be applied more widely. Trepal, who recently completed his doctorate in industrial archaeology and heritage, notes that the field reminds modern city-dwellers that our lives are layered on the past experiences and decisions of those who came before us.
“This research is not simply archaeology to learn how people lived in the past,” Trepal said. “This is about the industrial evolution of cities and the deindustrialization of cities that has created a new landscape. What does it mean to live in a postindustrial landscape? We use geospatial technologies in the study of modern cities to understand that the impacts of the past still shape our lives today.”
Trepal notes that it’s all too easy for many people to ignore the remains of an industry once it’s shuttered.
“When you’re talking about human health or cumulative hazards, these places looked very different when these places are created,” Trepal said. “In the Keweenaw, the mines aren’t really gone, they’re very much still here. It’s about giving presence to things that are not here anymore to the casual eye.”
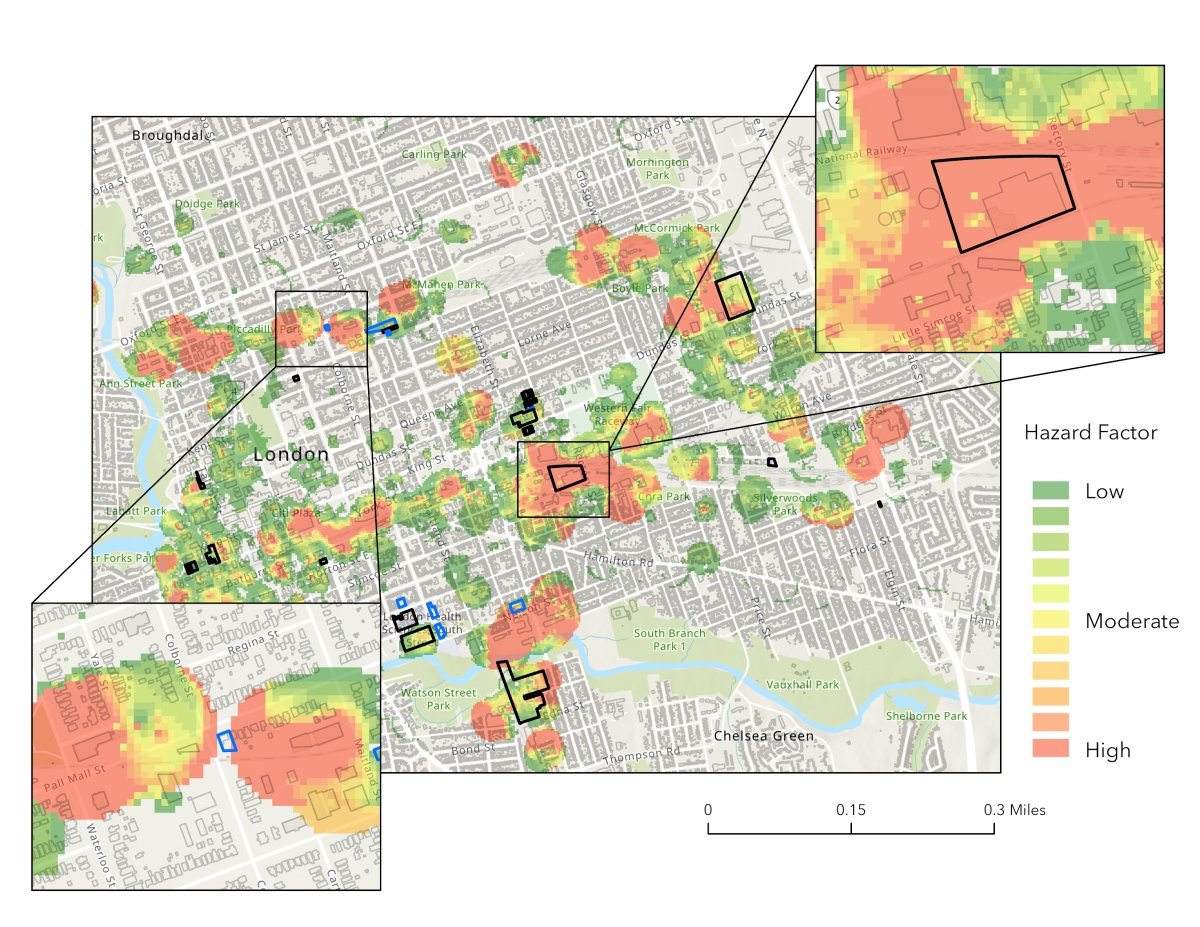
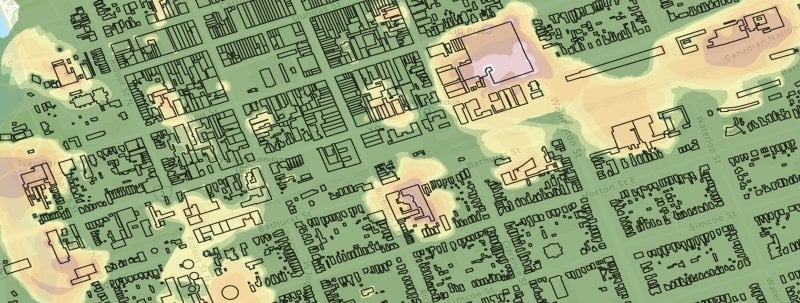
By summing the acute hazards recorded in multiple time periods, the London HSDI can be used to visualize the estimated accumulation of industrial hazards on a postindustrial landscape and highlight higher-risk hotspots. This predictive model can then be checked against real-world pollution testing data. In the image above, contaminated properties are outlined in black, while properties that were tested but did not contain contamination are outlined in blue. Image Credit: Dan Trepal
The model incorporates fire insurance and municipal maps, as well as publicly available pollution data (from soil and water testing) and zoning codes, then applies weighted spatial and temporal data to identify hazard hotspots within a community over time and space. Trepal and Lafrenière compared the model’s predictive hazard map to London municipal records to verify the quality of the model.
Origins and Landscapes
An important part of the story of the Rust Belt is that of immigration. Trepal is a part of the Geospatial Research Facility, directed by Lafrenière, and will also participate in the francophone migration project. GIS and archaeology combined create an innovative lens through which to view the immigrant experience, whether in the 1860s, 1940s or current day. It is common in the U.S. that immigrant communities and communities of color are more likely to live near industrial hazards than white people (a topic that largely spawned the field of environmental justice).
“Your origin affects the landscape of the community,” Trepal said. “Shining a light on that is important, it’s who we are as Americans. People have reacted to immigration policies in this country before, and it happened again and again with different groups of people.”
Next Steps
Trepal and Lafrenière hope that planners, developers, heritage professionals, health officers and community organizations will apply the model in cities throughout the Rust Belt.
“This is scalable from millimetric scale to the national scale,” Trepal said. “A polluted city is not polluted throughout its geographical area, and not throughout to the same extent. The model provides a way of looking at a city holistically that costs municipalities less money and enables planners and policy makers to make better decisions for their communities from an environmental perspective.”
Michigan Technological University is an R1 public research university founded in 1885 in Houghton, and is home to nearly 7,500 students from more than 60 countries around the world. Consistently ranked among the best universities in the country for return on investment, Michigan's flagship technological university offers more than 185 undergraduate and graduate degree programs in science and technology, engineering, computing, forestry, business, health professions, humanities, mathematics, social sciences, and the arts. The rural campus is situated just miles from Lake Superior in Michigan's Upper Peninsula, offering year-round opportunities for outdoor adventure.


Comments