Leaf Area Index (LAI) measurements help to parameterize the water balance in Michigan in order to obtain accurate estimations of evapotranspiration. MTRI is producing maps of LAI in the upland watersheds using modified MODIS algorithms applied to Landsat or ASTER 15-30 m data.
High resolution Landsat LAI products for a study area are being developed for the ILHM model, which currently uses coarser resolution MODIS LAI products. Published LAI algorithms are being used to predict LAI for non-wetland cover types. We focus on data collected to use in creating an empirical LAI algorithm for wetlands.
LAI Mapping
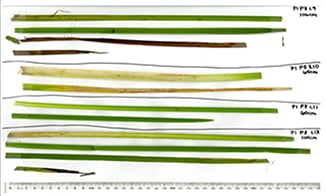
In the summer of 2013, field crews continued collecting LAI measurements of Typha and Phragmites in large monotypic wetland complexes (Figure and Table below). Many of the large Phragmites complexes in southeastern Michigan had been chemically treated recently, which accounted for the relatively low ratio of Phragmites sites to Typha sites. Field crews collected LAI measurements using a LI-COR LAI-2200 Plant Canopy Analyzer with two optical sensor wands: one mounted on a pole above the canopy and a second to collect light readings simultaneously under the canopy. To check the quality of our LI-COR readings we began harvesting wetland plants to physically measure LAI using an optical scanner.
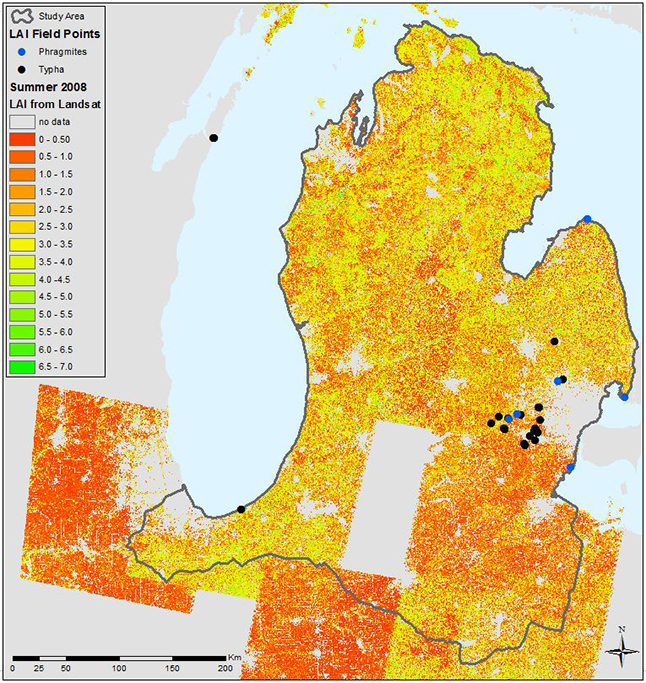
To create LAI maps of our study area we utilize published empirical equations for mapping LAI based on land cover type (Fernandes et al. 2003). Our image processing scheme utilizes LEDAPs software for atmospheric correction and then we merge the Landsat surface reflectance data with the Cropland Data Layer from CropScape in order to select the appropriate empirical algorithms (Boryan et al. 2011; Han et al. 2012). We have mapped our study region using cloud free Landsat data from the summers of 2008 and 2009. We also plan to explore techniques to increase our temporal resolution with sharpened MODIS data.
Work has begun on building a radiative transfer model of wetland vegetation (DIRSIG Digital Imaging and Remote Sensing Image Generation model) in order to supplement our field campaign measurements with modeled reflectance values from scenes with either Typha or Phragmites with various LAI values. We have built CAD drawings of both Typha and Phragmites and collected spectral measurements of both Typha, Phragmites, and three different ground surfaces (water, dry, and wet) using MTRI’s Analytical Spectral Device Fieldspec3 Spectroradiometer.
| Wand Readings Only | Destructive Samples Only | Both Measurements | |
|---|---|---|---|
| Phragmites | 4 | 1 | 4 |
| Typha | 20 | 1 | 12 |