
Stream gauges in the Keweenaw help us understand ecosystems and prepare our communities for flooding—but their existence is in jeopardy.
One of the most basic characteristics used to describe a stream is how much water it carries—the flow, or more accurately, discharge—which is measured in units of volume per time (typically cubic feet or cubic meters per second). Understanding how river discharge changes with time tells us important information about the stream, including how quickly something that is added to the river will be diluted and moved downstream. A river’s discharge rate also tells us how prone the river is to disturbances and what conditions the organisms that live there experience.
Understanding the river flow is also key for human communities. It allows planning for how quickly we can expect lakes and reservoirs to fill and how much water can be withdrawn for irrigation or drinking.
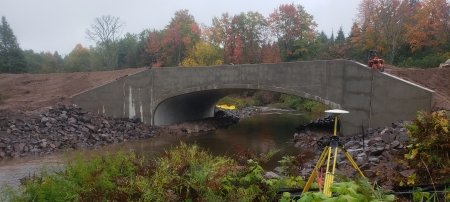
River flow also helps communities prepare for potential natural disasters, such as understanding how likely a river is to overflow its banks to cause a flood, and how to build culverts and bridges to withstand a flood like the one that Houghton, Michigan, experienced in June 2018.
For all of these reasons, the U.S. Geological Survey (USGS) operates a nationwide streamflow monitoring program. The data from these rivers is used to both understand current streamflow conditions, as well as to create long-term records of river discharge.
River flow records are crucial for understanding flood frequency—how often events of a certain size are measured on a stream—which can then predict the likelihood of flooding events of a certain size. Perhaps you have heard of a “100-year flood.” What this really means is that a flood of that size has a 1 in 100, or a 1 percent likelihood of happening in any given year.
The more data we have, the more accurate our predictions; a 100-year flood event is really difficult to predict with only five or 10 years of data. The more data we have, the better we get at predicting the likelihood of rare events—particularly those large events that wipe out culverts, roads, bridges and everything else in their paths.
We need flow data to be better prepared in the case of future floods and to create infrastructure that is robust to the highest flows that are likely to occur on a regular basis.
"Flow data helps protect communities that are in the path of possible future events."
Historically, there have been very few USGS discharge monitoring stations in the Keweenaw: The gauge at the Trap Rock River near Lake Linden, which is funded cooperatively by the USGS and Michigan Department of Environmental Quality, has continuously monitored discharge since 1966, which seems like a long time, but 50 years of data is still not enough to accurately predict rare events. To increase the understanding of spatial variation in water flow in the Keweenaw, the USGS installed four temporary gauges with Great Lakes Restoration Initiative funds in 2014 at the Pilgrim River, Coles Creek, Gratiot River and the Montreal River.
When initial funding ran out, the gauges at Coles Creek and the Montreal were shut down, but researchers at Michigan Tech and the U.S. Fish and Wildlife Service were able to lobby the USGS to keep the gauges at the Gratiot and the Pilgrim Rivers going through September 2018. At Michigan Tech, we particularly rely on the gauge at the Pilgrim to provide data used in support of graduate student research on nutrient cycling and fish movement, as well as for teaching in general and aquatic ecology classes.
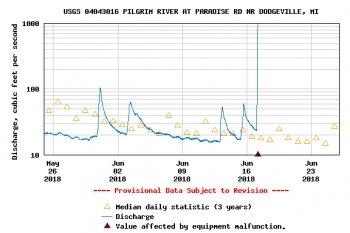
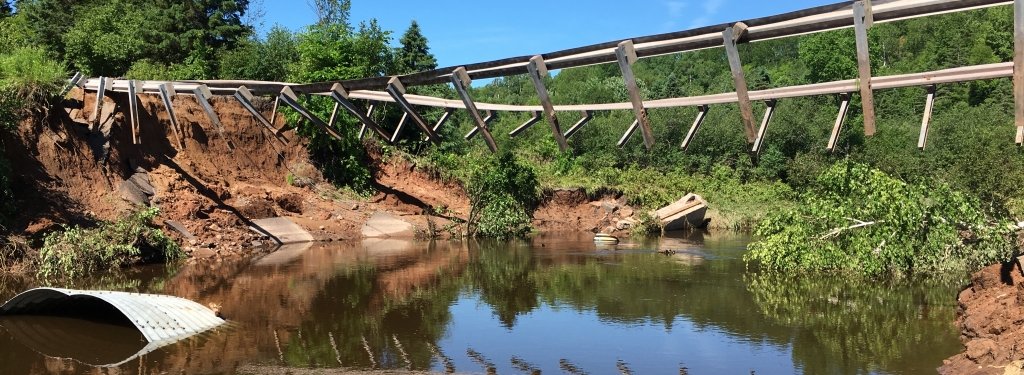
All was going well, until the June floods which were focused around the Pilgrim River watershed, took out the culvert and bridge at Paradise Road, wiping out the USGS gauge along with it.
What is going to happen at this site is unclear. The USGS is willing to reinstall the gauge at Pilgrim River if additional funding can be found to support its maintenance: $15,700 per year.
The USGS may have Cooperative Matching Funds available to help defer some of the operational costs of restored gauges, if they can find a funding partner or partners who is a taxing authority, Federally-recognized tribe, or State-operated college or university. Meanwhile, our projects are moving along without continuous discharge monitoring—which is a pain but not fatal.
Replacing the stream gauge at the Pilgrim River and maintaining the full fleet of gauges in the Keweenaw could help us with the answers to important questions:
- How can we plan for rebuilding our infrastructure following the recent flooding if we have so little data to use to understand when a flood may happen again in the future?
- How can we understand how the frequency of floods is changing due to climate change, beyond anecdotal stories of roads washing out more frequently and more failed culverts?
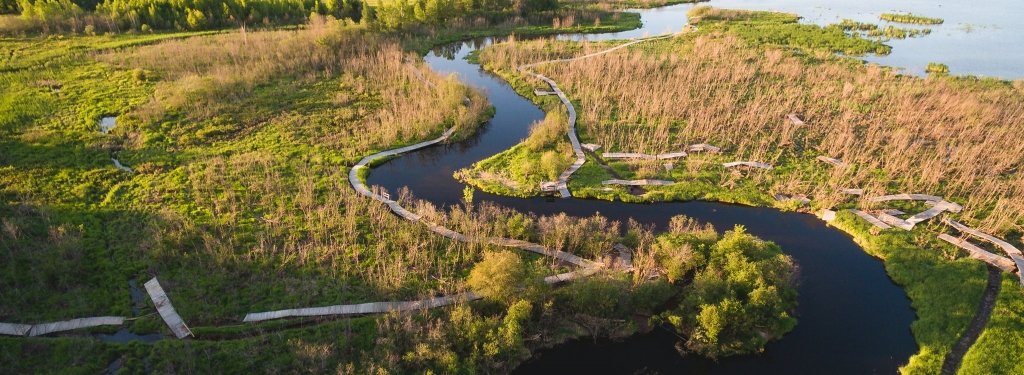
- How can we understand the linkages between watersheds and Lake Superior if we cannot understand the dynamics of the streams that provide water, sediment and nutrients to this vital freshwater resource?
Losing a single stream gauge may not seem like a big deal, but when there is so little data to begin with, it represents a lost opportunity for more long-term understanding and perspective on flood frequency in the future. Stream gauges are not only good for research and understanding the ecosystems we inhabit, but also for building resilient communities that are prepared for floods and whatever amplified weather events the future brings.
Michigan Technological University is an R1 public research university founded in 1885 in Houghton, and is home to nearly 7,500 students from more than 60 countries around the world. Consistently ranked among the best universities in the country for return on investment, Michigan's flagship technological university offers more than 185 undergraduate and graduate degree programs in science, technology, engineering, mathematics, computing, forestry, business, health professions, robotics, psychology, social sciences, humanities, and the arts. The rural campus is situated just miles from Lake Superior in Michigan's Upper Peninsula, offering year-round opportunities for outdoor adventure.

Comments