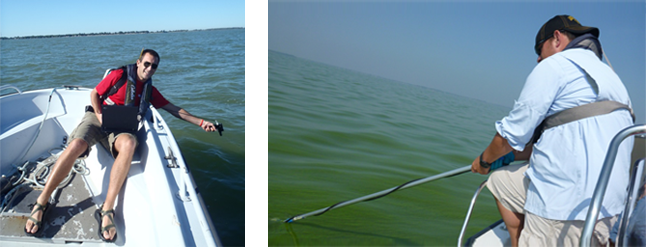
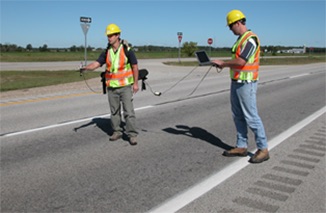
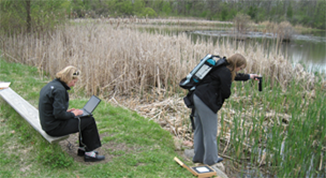
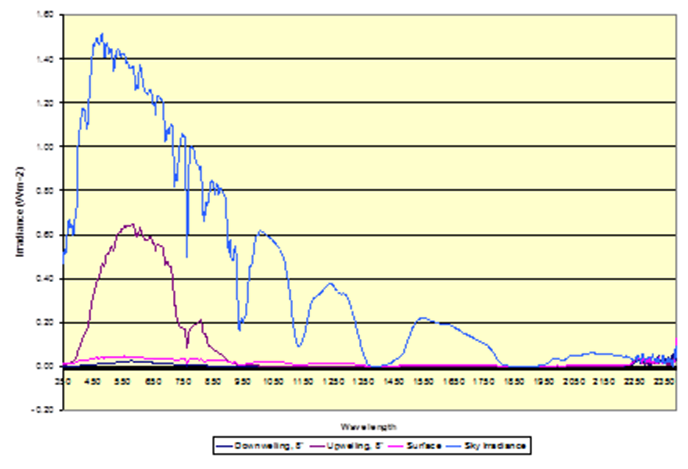
The FieldSpec3 Spectroradiometer enhances MTRI’s remote sensing field capabilities This instrument accurately measures reflectance, transmittance, radiance, or irradiance in the full spectrum range of 350-2500 nm. It is specifically designed for field environment remote sensing to acquire visible near-infrared (VNIR) and short-wave infrared (SWIR) spectra. Capabilities include both terrestrial and aquatic spectral data collection using three detectors and multiple foreoptic attachments, including one designed specifically for the laboratory environment. In aquatic collections, researchers at MTRI utilize a custom-built gimbal and rod which allows for deployment from boats, bridges, etc.
| Spectrum | Range |
|---|---|
| VNIR-SWIR1-SWIR2 | 350–2500 nm |
| VNIR only | 350–1050 nm |
| WNIR-SWIR1 | 350–1800 nm |
| SWIR1 only | 1000–1800 nm |
| SWIR1-SWIR2 | 1000–2500 nm |
| SWIR2 only | 1800–2500 nm |
| VNIR and SWIR2 | 350–1050 nm and 1800–2500 nm |
Spectral Resolution
- 3 nm (Full-Width-Half-Maximum) at 700 nm
- 10 nm (Full-Width-Half-Maximum) at 1400 nm
- 10 nm (Full-Width-Half-Maximum) at 2100 nm
Sampling Interval
- 1.4 nm for the spectral region 350-1000 nm
- 2 nm for the spectral region 1000-2500 nm
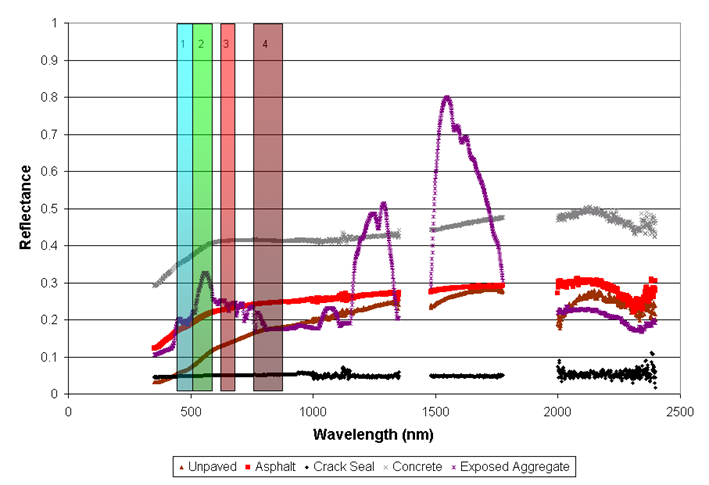
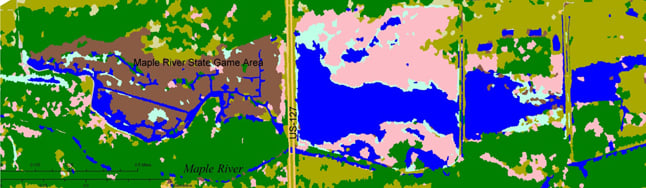
MTRI has applied the spectroradiometer to a variety of research projects, including turbidity and trophic state mapping; land cover analysis; the influence of bidirectional reflectance; road surface profiling; crop residue calculations; algal bloom assessment; and forest fire burned-area assessment. We maintain a computing infrastructure to analyze the spectral data, including ENVI and ERDAS Imagine software.