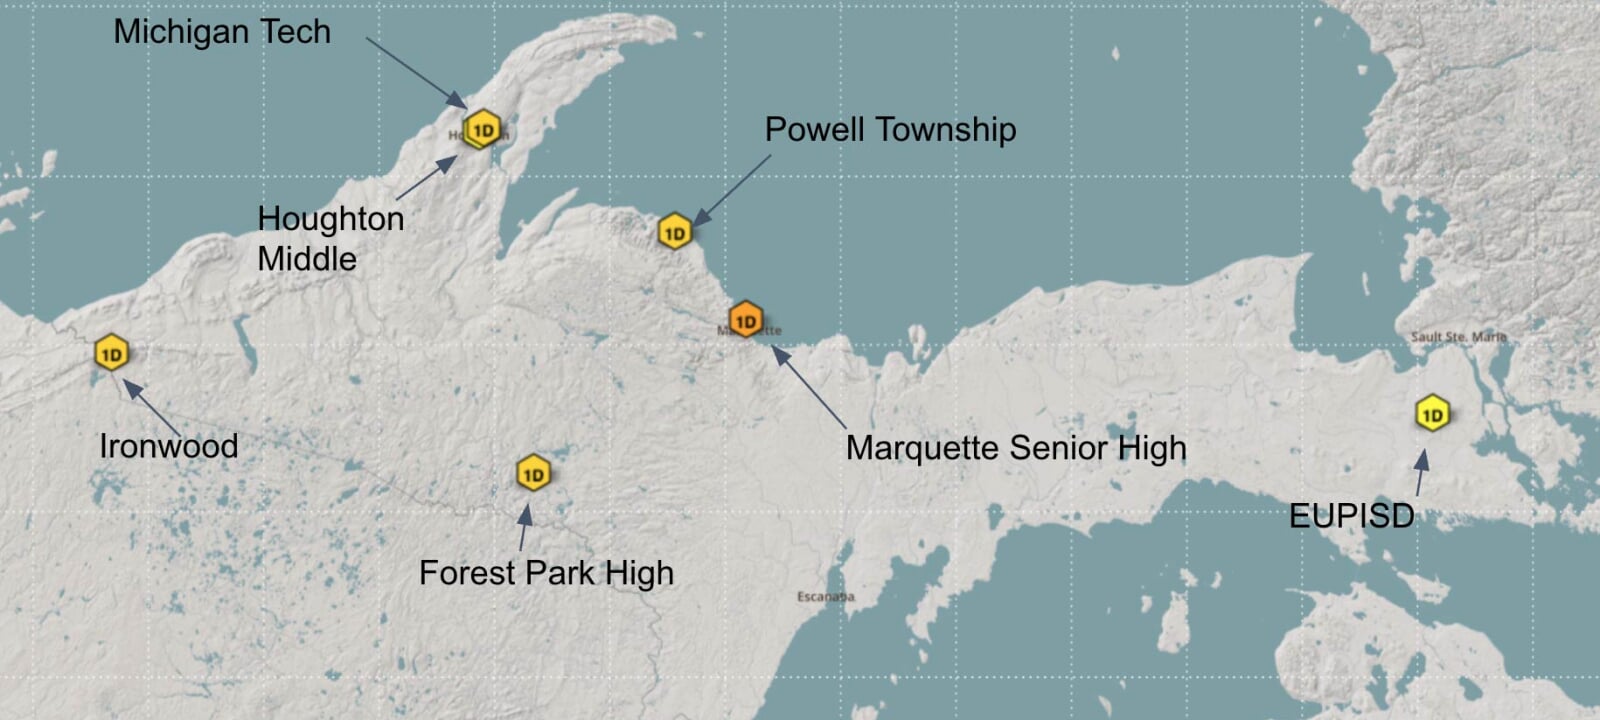
Find Your Station
Seismometers have been installed at schools across the Upper Peninsula.
Shaking can occur from large earthquakes across the globe to stomping from students. Educators can use online tools to examine this shaking.
What is shaking at these schools right now?
Real-time displays show the ground motion at any of several stations.
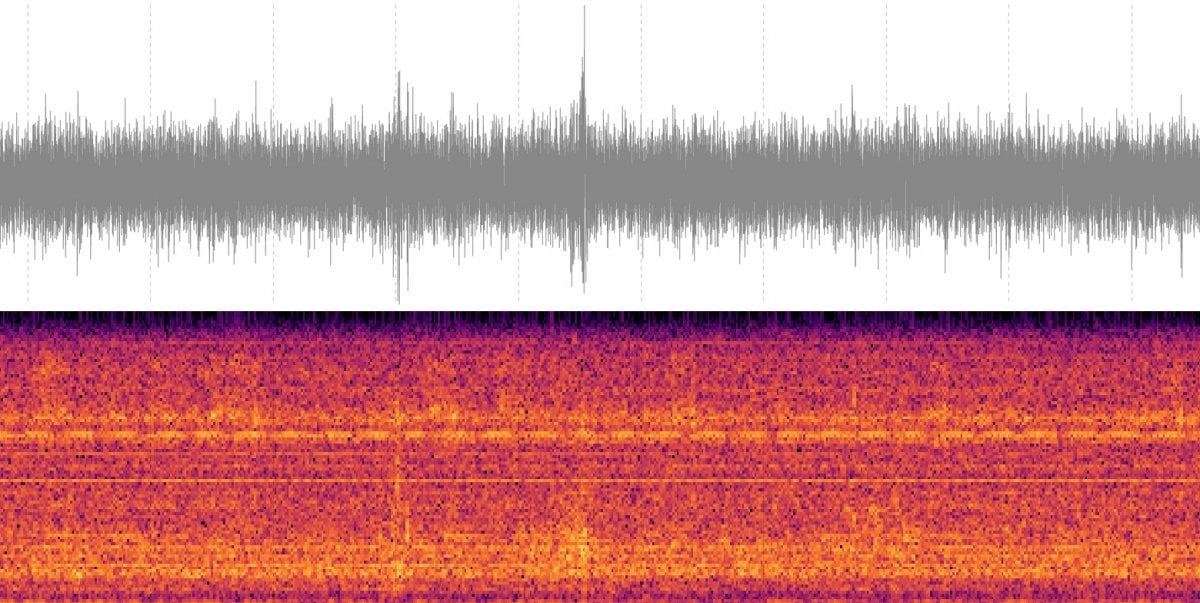
Each station displays live data in two ways.
- The top plot shows how the ground has moved over the last ten minutes. New data comes in from the right side and older data disappears off the left side.
- Frequency is the number of waves that pass a point in a fixed amount of time. The bottom plot highlights the frequency of the ground motion over time. Frequency is measured in Hertz, the number of cycles per second. The bright colors indicate that a lot of the waves at that time contained those frequencies.
These plots often show long streaks at a constant frequency. Vibrations in the building cause these streaks.
Shaking from earthquakes is larger. It occurs over a wide range of frequencies, so it is easy to distinguish from building noise.