Regional maps show the number of anglers, angler participation rates, and change in angler participation rates by county across the entire five-state region. Maps show anglers by county of primary residence, rather than where people fish.
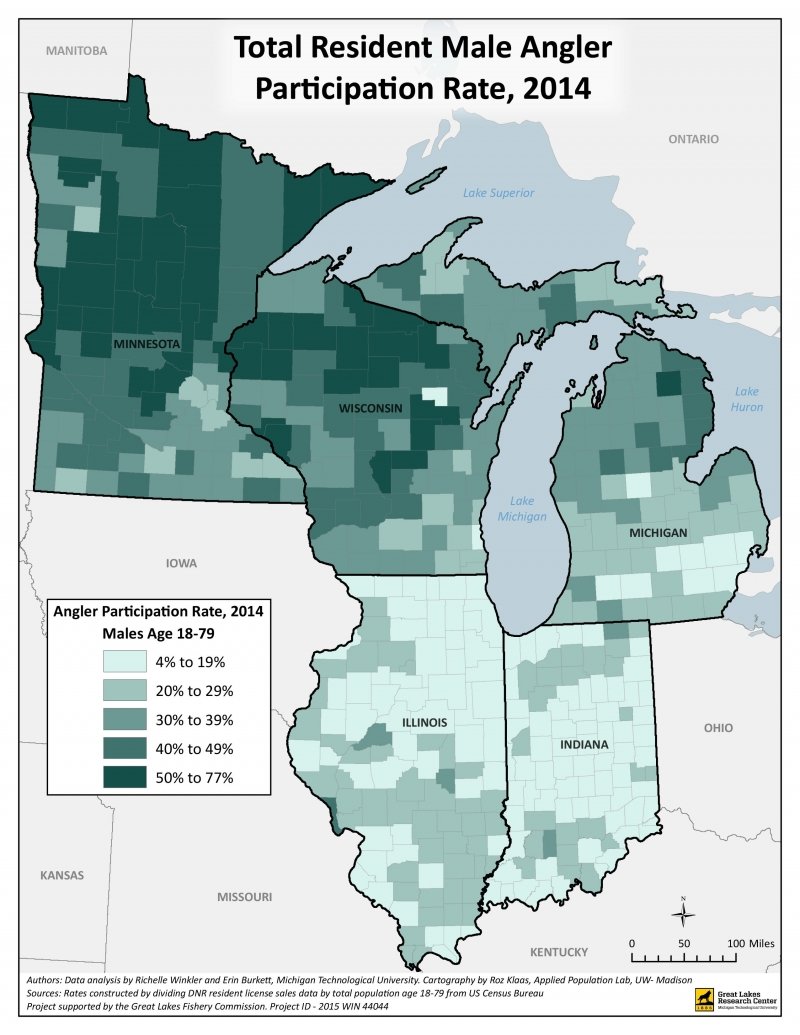
Male Anglers Participation Rate, 2014
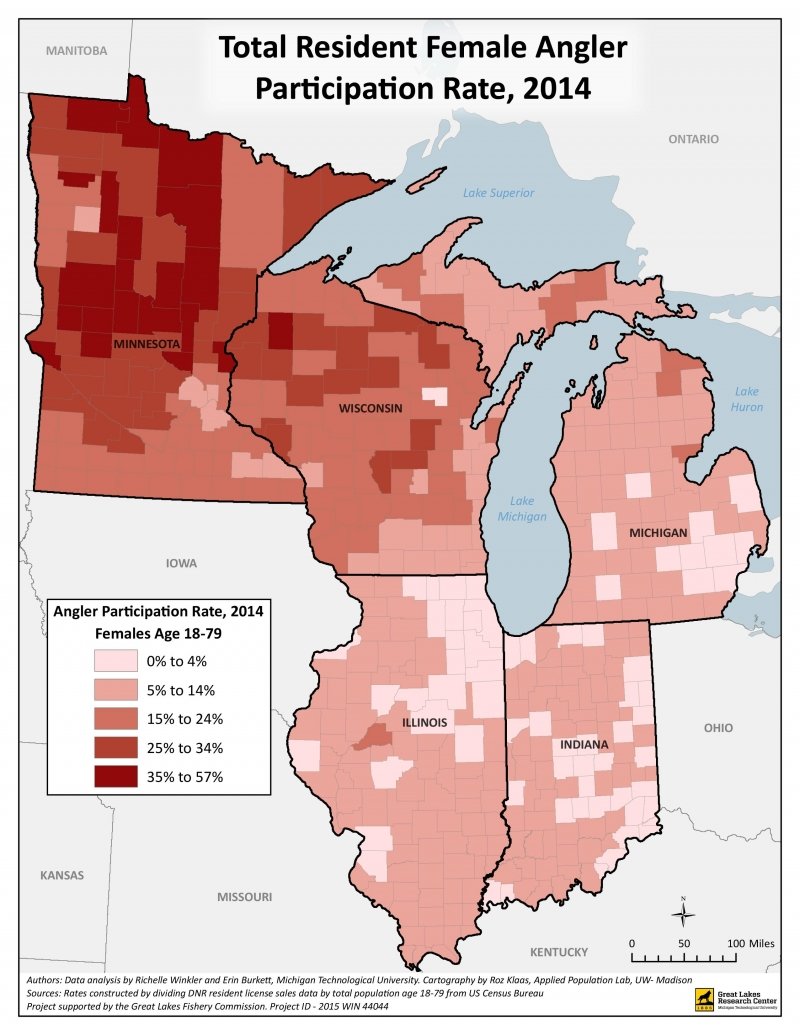
Female Anglers Participation Rate, 2014
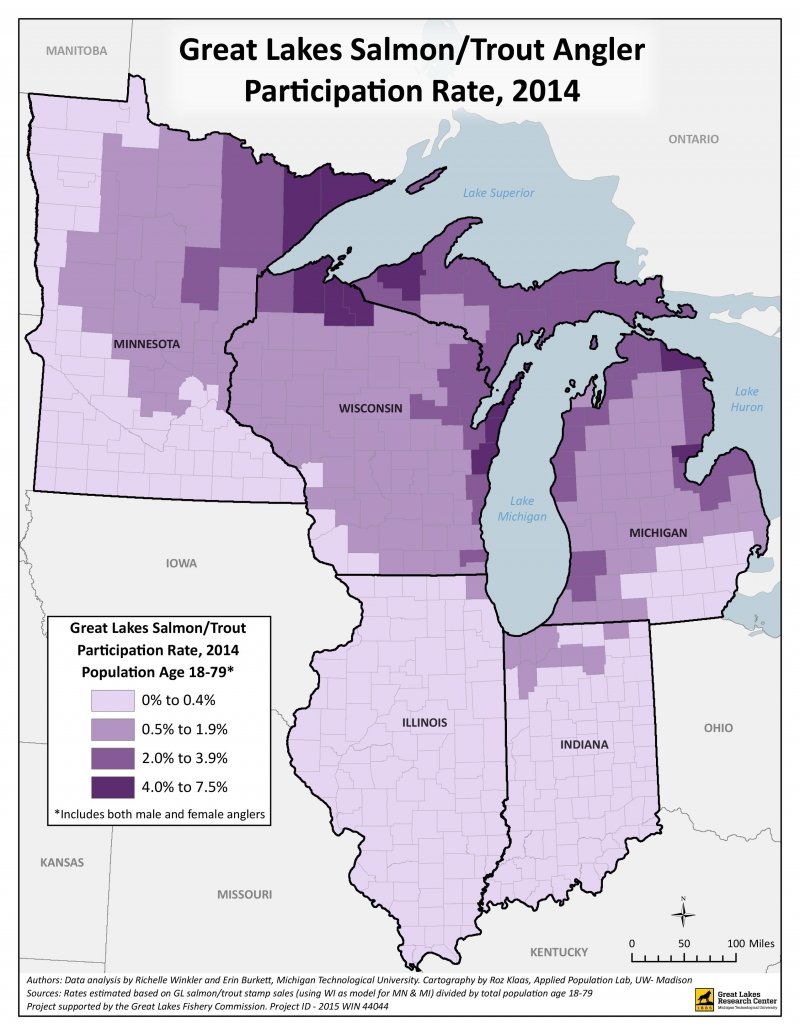
Salmon/Trout Anglers Participation Rate, 2014
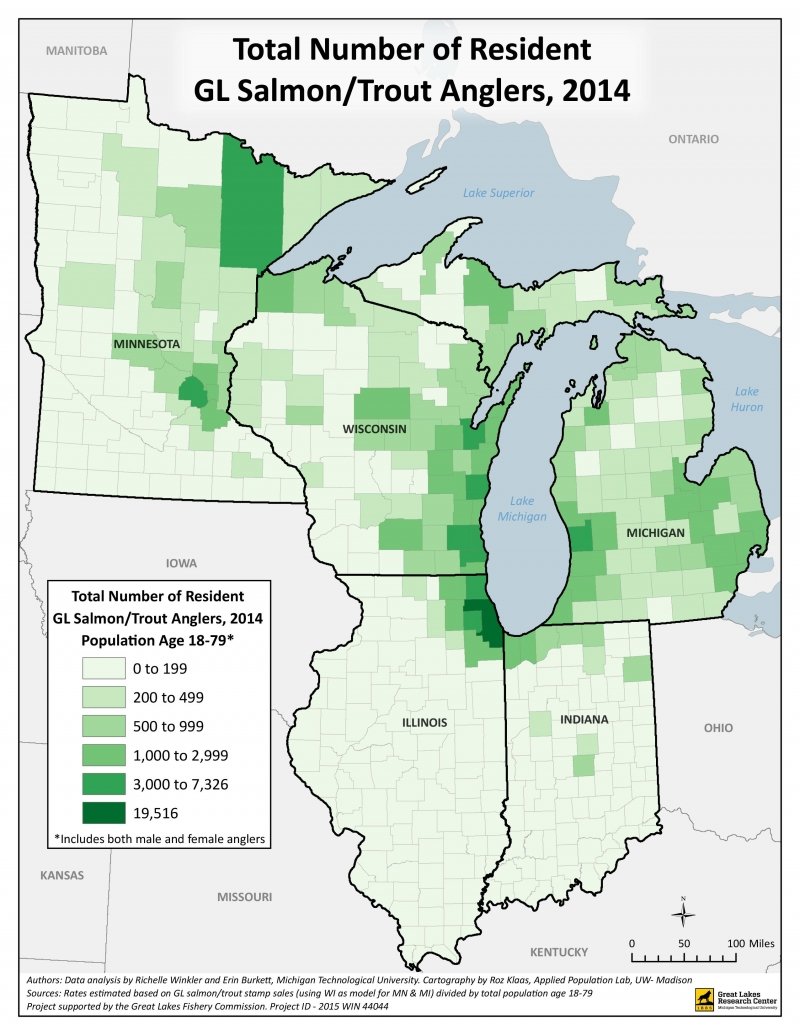
Resident Salmon/Trout Anglers, 2014
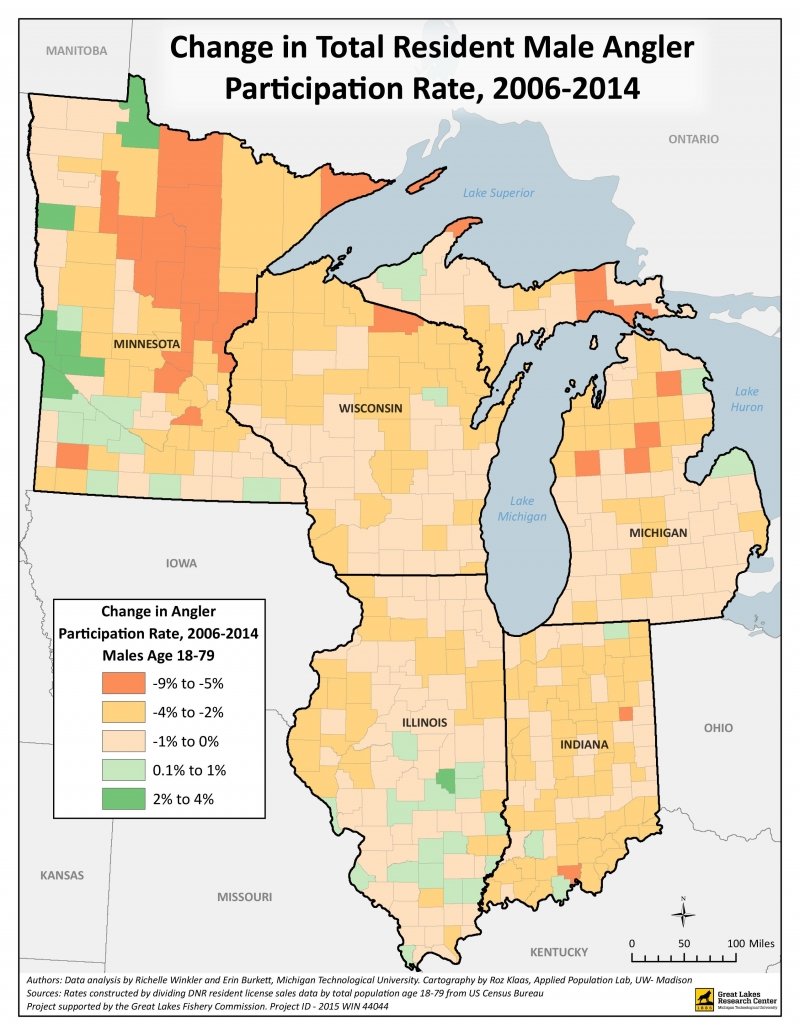
- Change in Male Anglers Participation Rate, 2006-2014
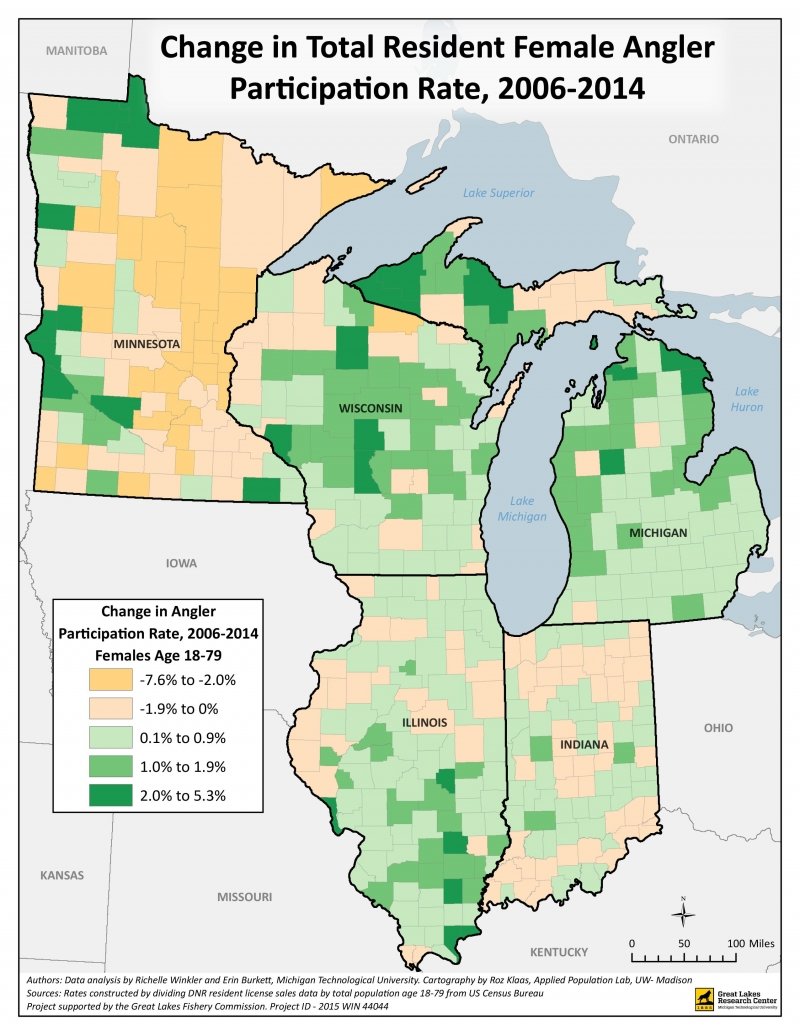
- Change in Female Anglers Participation Rate, 2006-2014
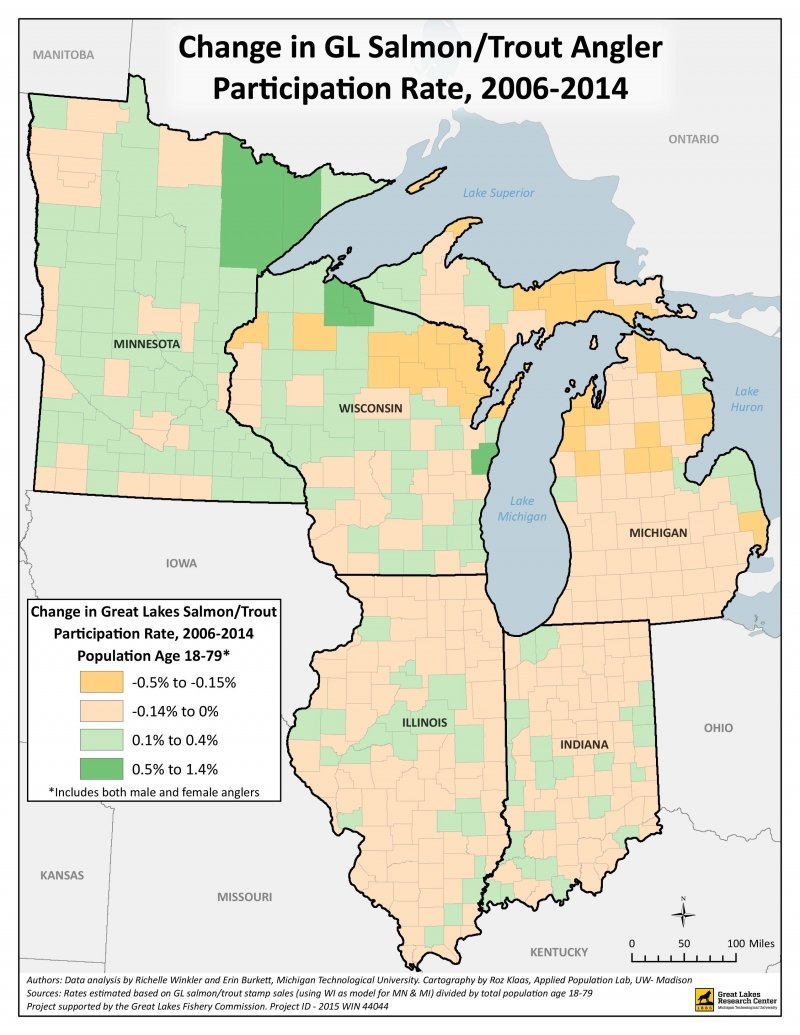
Change in Salmon/Trout Anglers Participation Rate, 2006-2014
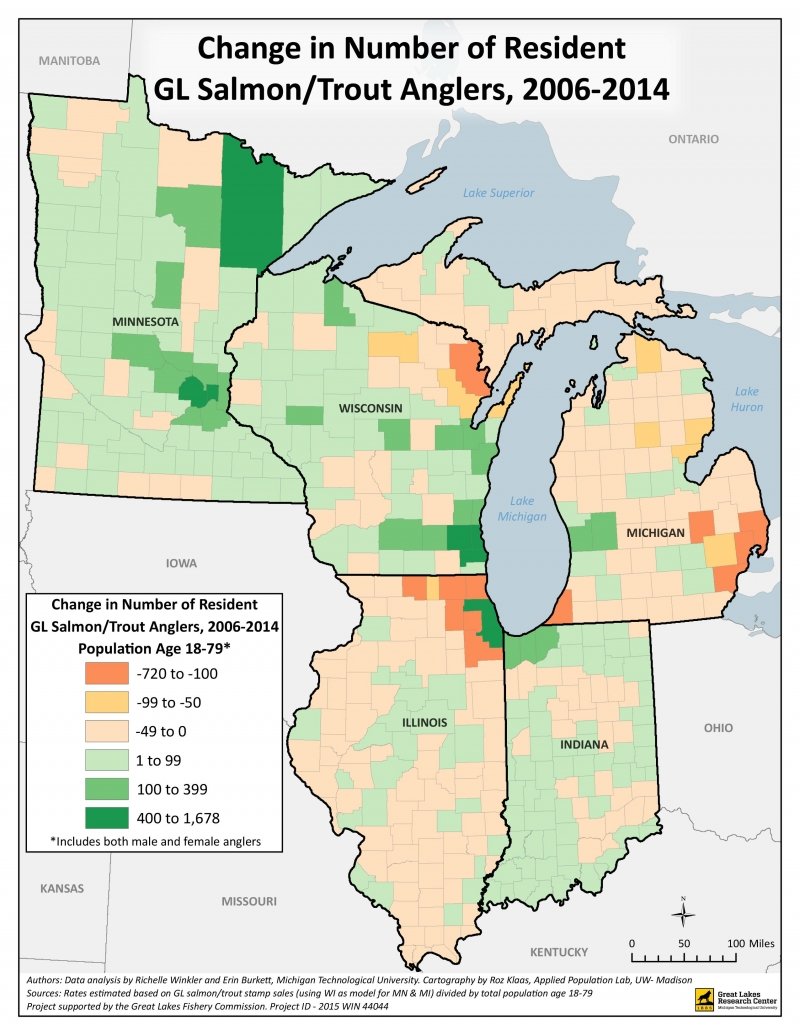
Change in Resident Salmon/Trout Anglers, 2006-2014
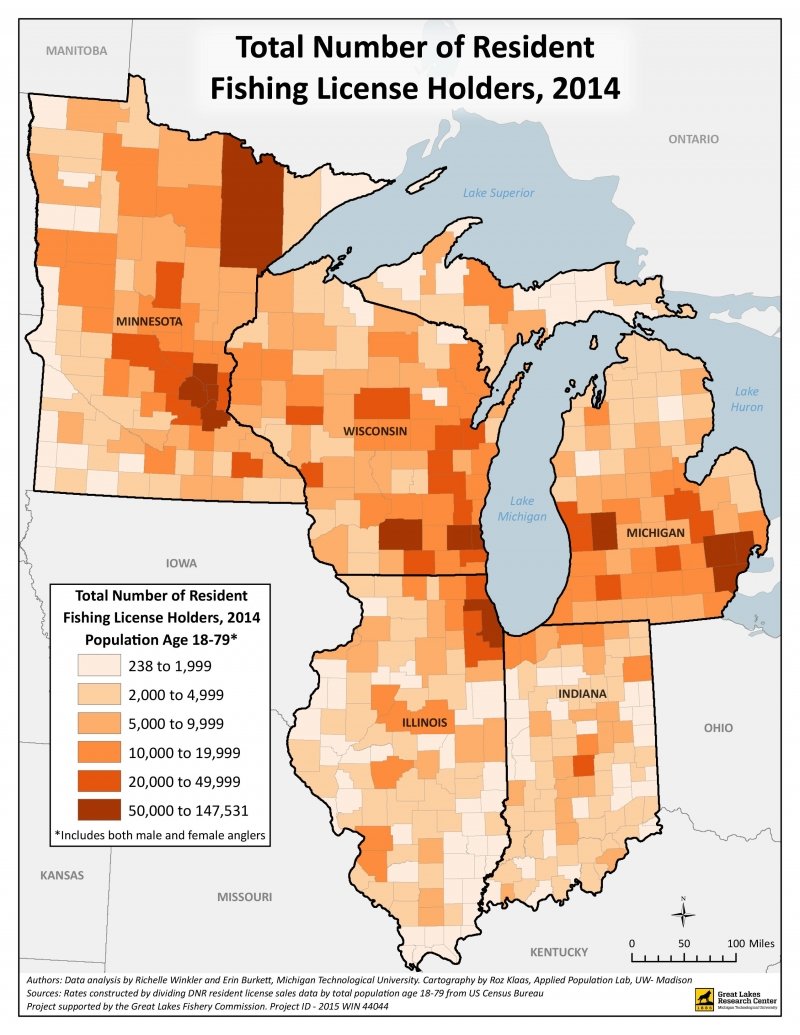
Resident License Holders, 2014
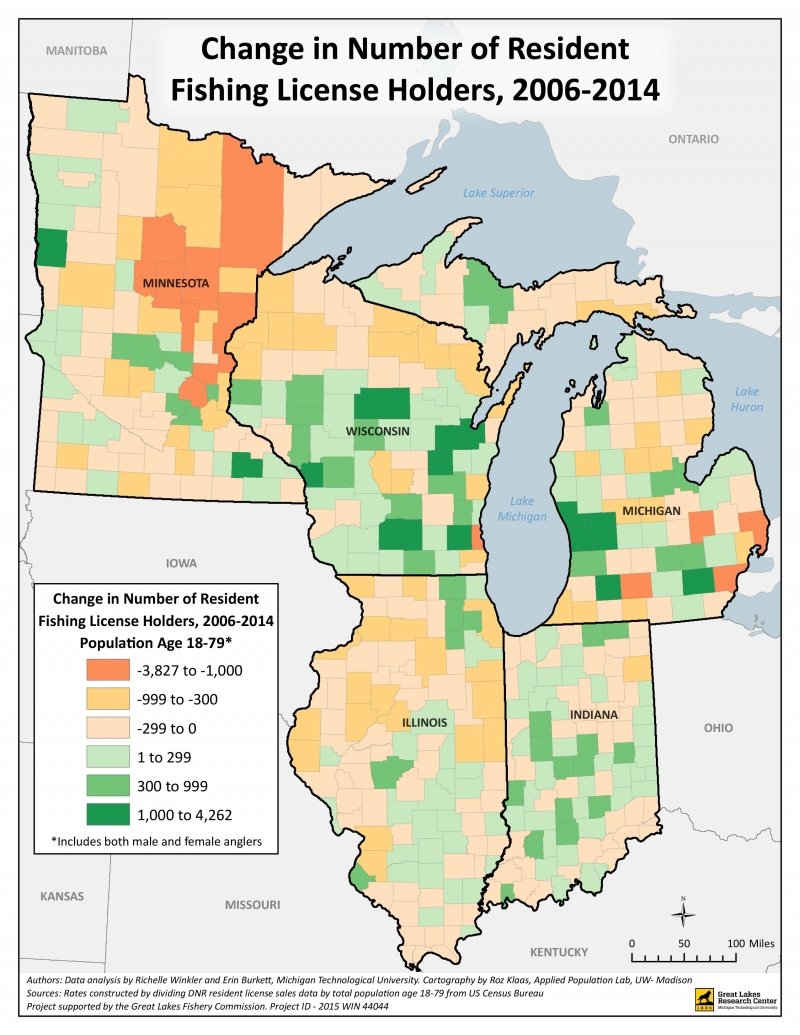
Change in License Holders, 2006-2014