The Michigan Tech Difference
Earn a world-class STEM-focused education at Michigan’s R1 flagship technological
university. Invest in yourself—and maximize your potential—at Michigan Tech.
Career and ROI Outcomes
Tech students have an average five year placement rate of 94.6 percent within six months of graduation (within their field of study) and are in the top
20 for highest early-career salaries in the nation at $82,400. The Wall Street Journal ranks Michigan Tech among the best colleges in the US and first in the state for
salary impact.
More than 400 companies attend our Career Fairs each year. Check out our Career Services to see how we support you in your career journey.
Build Skills and Grow
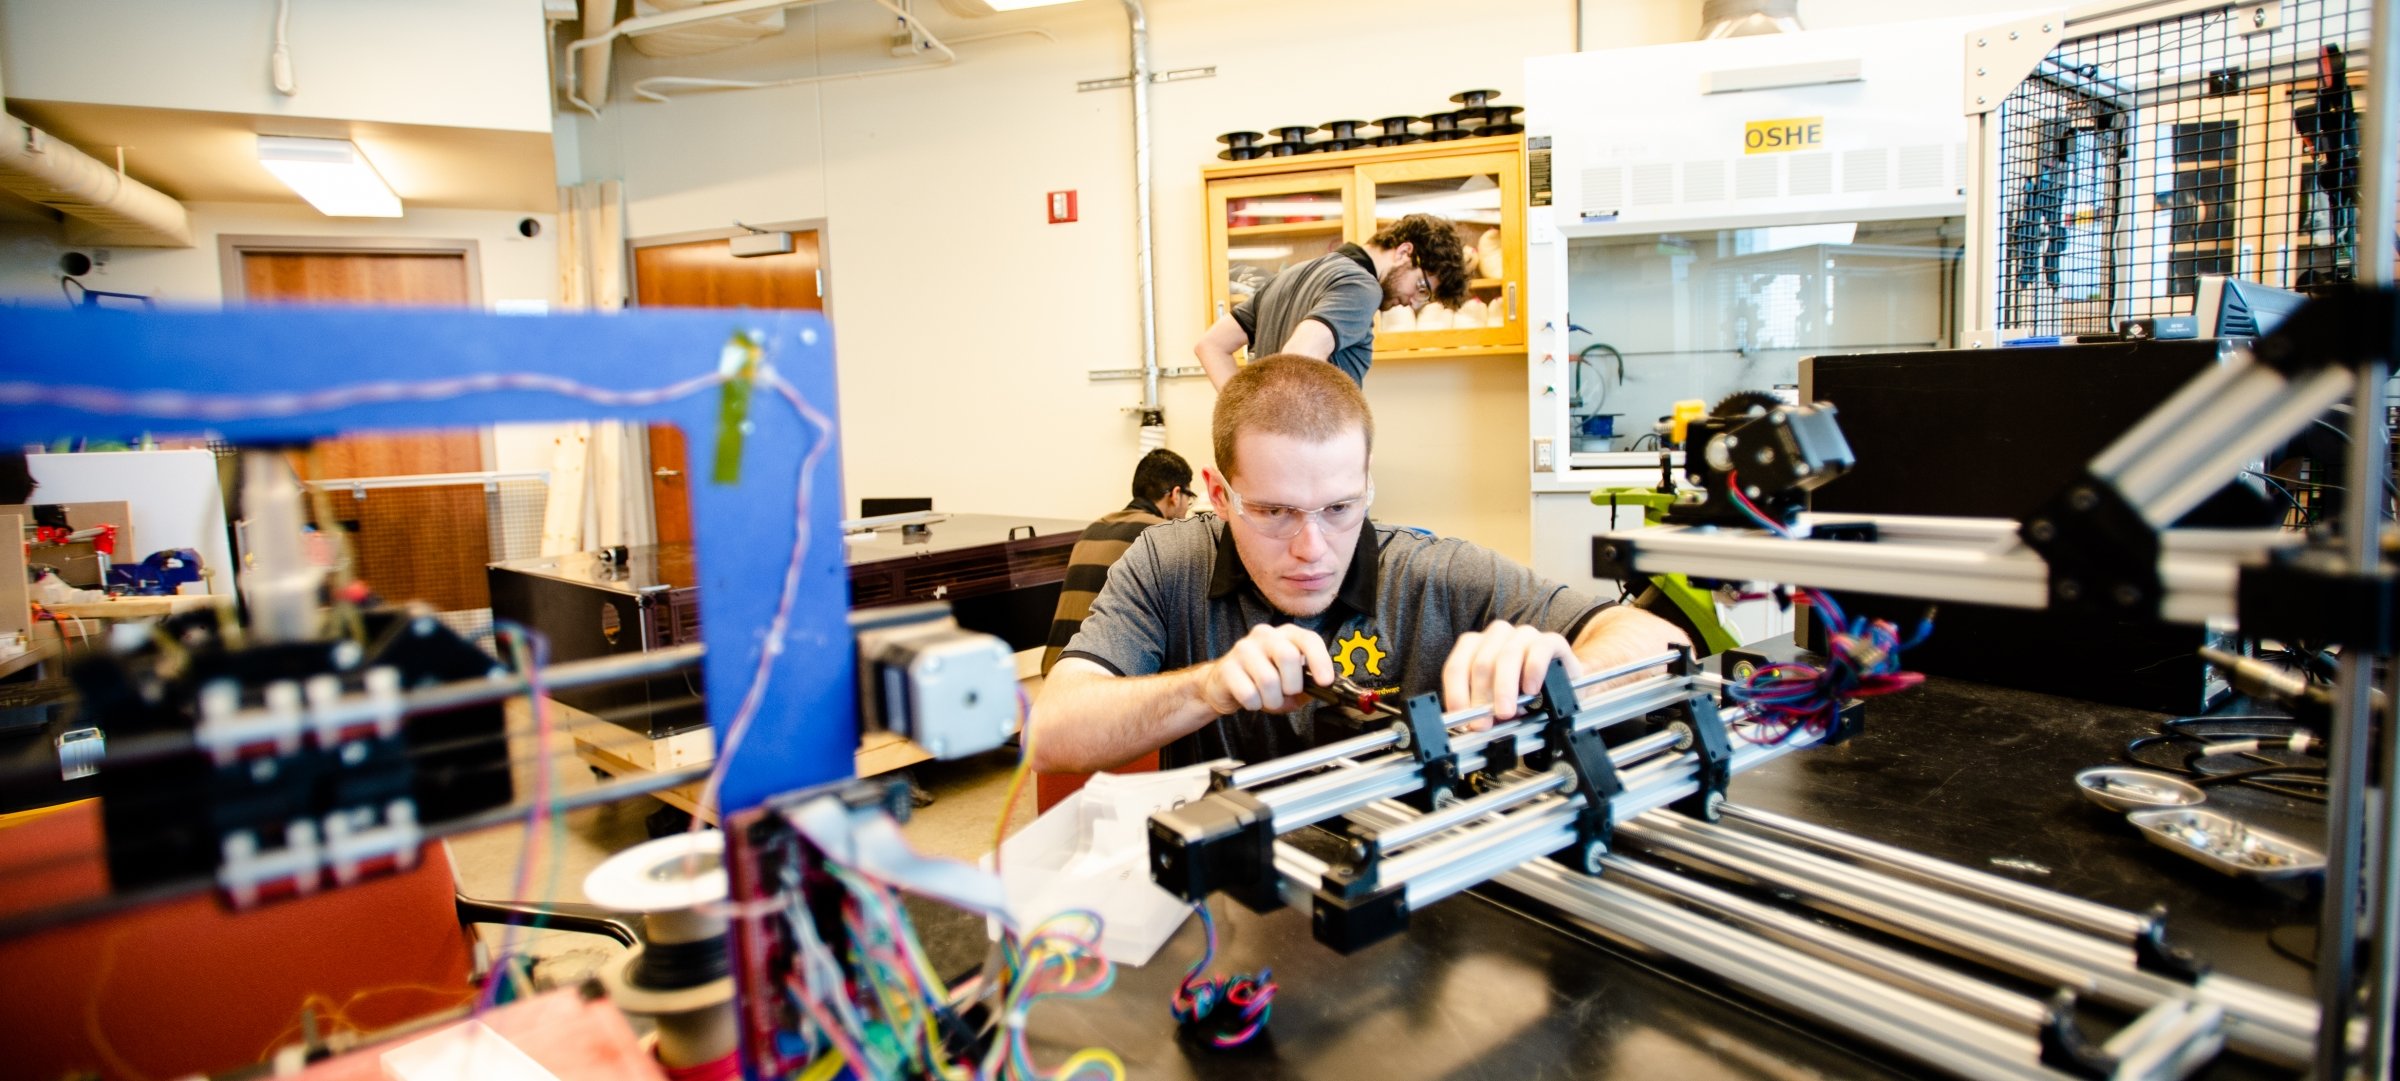
Work on real projects on real teams starting your first semester. Design, build, communicate, and present. Use the same equipment found in industry and use it early in your college career.
Build your resume your first year by developing skills and experiences employers look
for through undergraduate research. Join an Enterprise team and participate in senior design. Dive into what interests you.
Pavlis Honors College. Study abroad. Co-ops and internships across the country. There are opportunities to grow and experiences that will help
you—now and in the future.